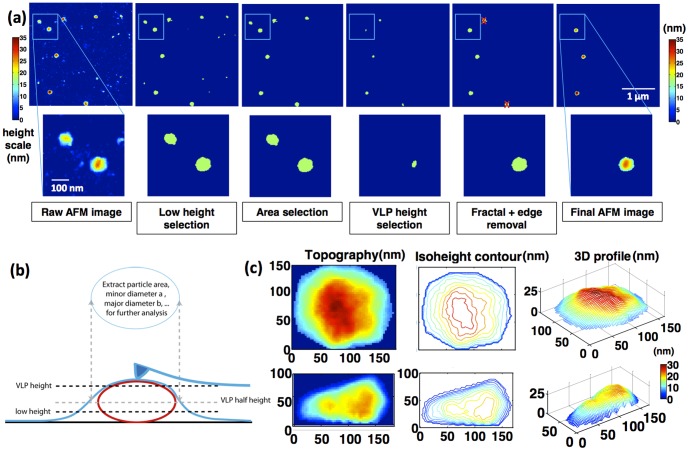
Figure 2. Automated image analysis.
(a) Example of the successive image analysis steps applied on a single image. (b) Cartoon of the principle of image analysis. (c) Various representation (color map, contour plots, 3D plots) of particles that were selected. Top VLP, down core. Interestingly, the contour map of the VLP shows a pronounced asymmetry close to its maximal height, reflecting the presence of an asymmetric object inside the VLP.

