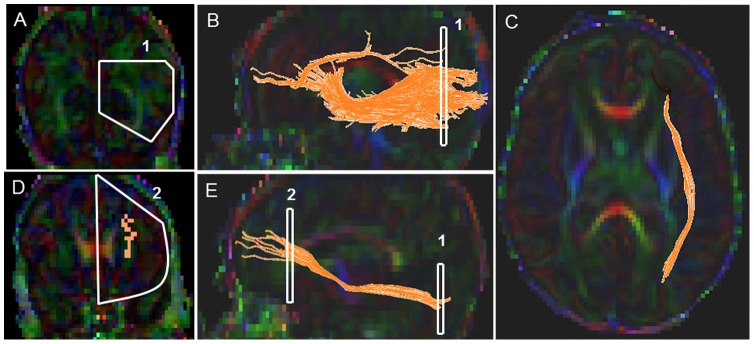
Figure 4. Location of ROIs on DTI color maps for the inferior fronto-occipital (IFO) tract in a preterm infant.

(A) First polygonal shaped ROI in coronal view; (B) Fiber trajectory after the first ROI was drawn in sagittal view; (C) Final trajectory of the IFO tract in axial view; (D) Polygonal shaped second ROI in coronal view; (E) Final trajectory of the IFO tract and the starting and the ending ROI points of the tract in sagittal view.
