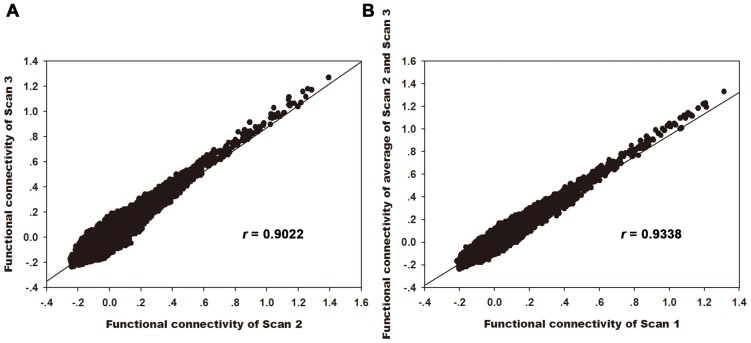
Figure 2. Consistency of functional connectivity strength of Broca's area in both short-term and long-term.
Scatter plots of whole brain RSFC strength for Broca's area between Scan 2 and Scan3 (short-term) (A), and between Scan 1 and average of Scans 2 and 3 (long-term) (B), each dot in the graph represents a 3×3×3 mm3 voxel. Both of these two correlation coefficients are larger than 0.9, it revealed great consistency of FC strength in short-term and long-term.

