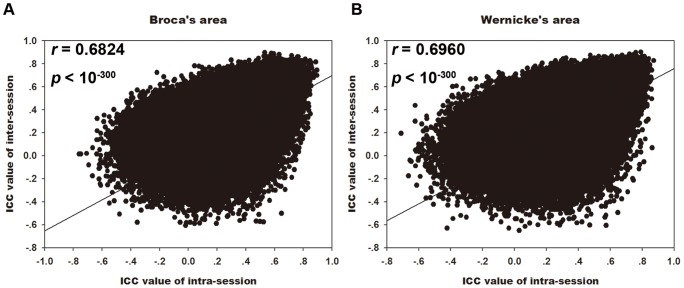
Figure 4. Relationship between short-term and long-term reliability of language network.
Scatter plots between short- and long-term reliability among whole brain resting-state language network seeding at Broca's area (A) and Wernicke's area (B). Each dot in the graph represents a 3×3×3 mm3 voxel. Both of these two correlation coefficient are larger than 0.65, indicating short-term and long-term reliability are significantly correlated.

