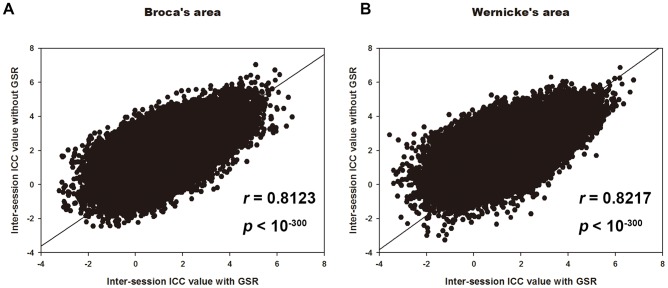
Figure 11. Relationship between ICC values of two regression conditions.
Scatter plots of whole brain RSFC inter-session ICC values between with and without global signal regression. Both Broca's (A) and Wernicke's areas (B) are depicted. Each dot in the graph represents a 3×3×3 mm3 voxel. Both of these two correlation coefficient are larger than 0.8. It reveals high correlation of temporal reliability no matter the global signal was regressed or not.

