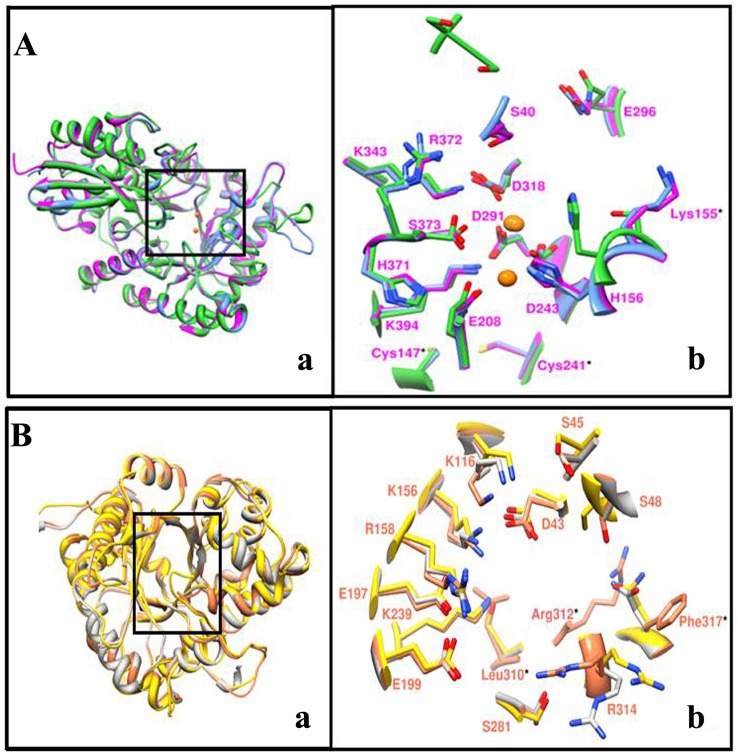
Figure 1. Structural overlay of in-silico modelled (A) LdEno (magenta), 1OEP (sky blue) and 2XSX (green) in ribbon representation (left) and (B) LdAld (coral), 1EPX (grey) and 2ALD (green) in ribbon representation (yellow).
Close view of superimposed active site (right) residues in mixed representation (ribbon and stick). Fully conserved residues are labelled as single letter code while unique residues belonging to LdEno and LdAld are labelled as three letter code with star marks.

