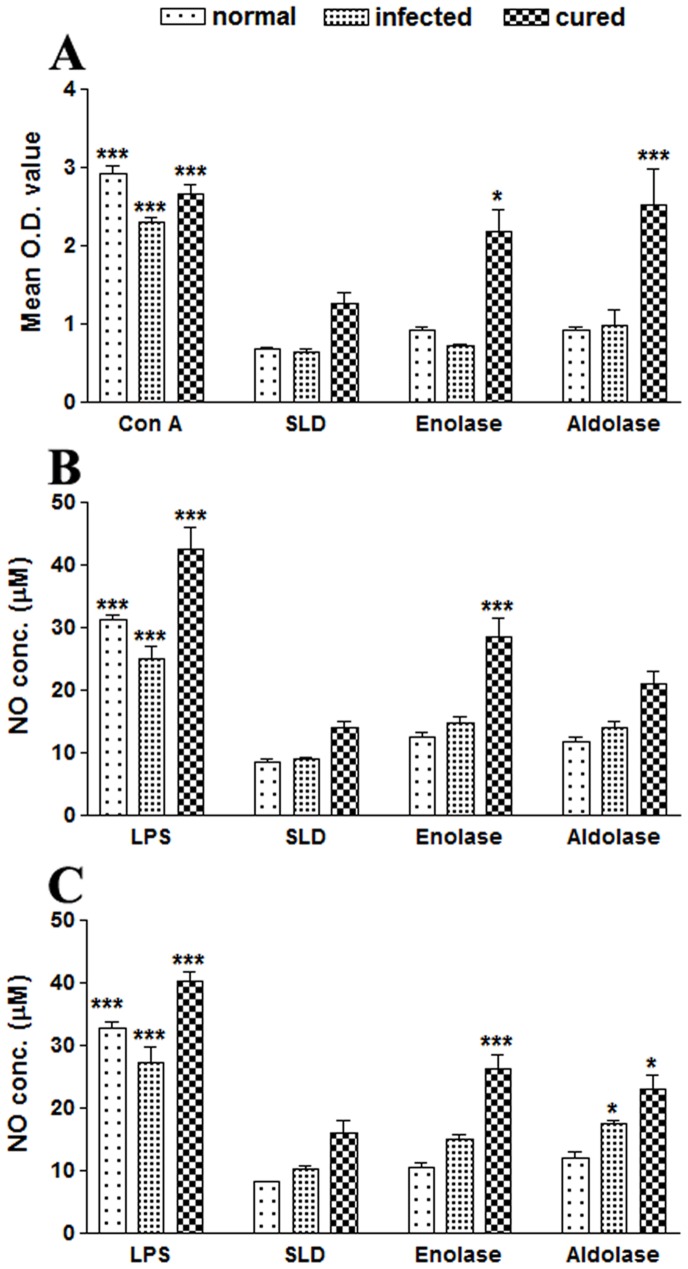
Figure 2. In vitro cellular responses in lymphocytes of cured hamsters’; LTT response in (A) lymphocytes from normal, L. donovani infected (30 day p.c.) and cured hamsters (30 day p.t. with miltefosine) in response to Con A, SLD, rLdEno and rLdAld at 10 µg/ml each for 5 days and 18 hours prior to termination of experiment 50 µl of XTT was added and the absorbance was read at 480 nm taking 650 nm as reference wavelength.
Proliferation was represented as mean OD of stimulated culture - mean OD of unstimulated control. Each bar represents the pooled data (mean ± S.D. value) of 6 individuals and the data represent the means of triplicate wells ± the S.D. Nitric oxide production (µM) by (B) peritoneal macrophages of hamsters and (C) J774 A.1 macrophage cell line. The peritoneal macrophages as well as J774 A.1 cells were primed with the supernatants of stimulated lymphocytes (3 days with mitogen and 5 days with antigens) of normal, infected and cured hamsters in response to rLdEno, rLdAld, SLD and LPS respectively at a concentration of 10 µg/ml each. The estimation of NO production was done using Griess reagent in supernatants collected from macrophage cultures 24 h after incubation and the absorbance of the reaction product was measured at 540 nm. Significance values indicate the difference between the SLD and rLdEno/rLdAld stimulation (*, p<0.05; **, p<0.01; and ***, p<0.001).

