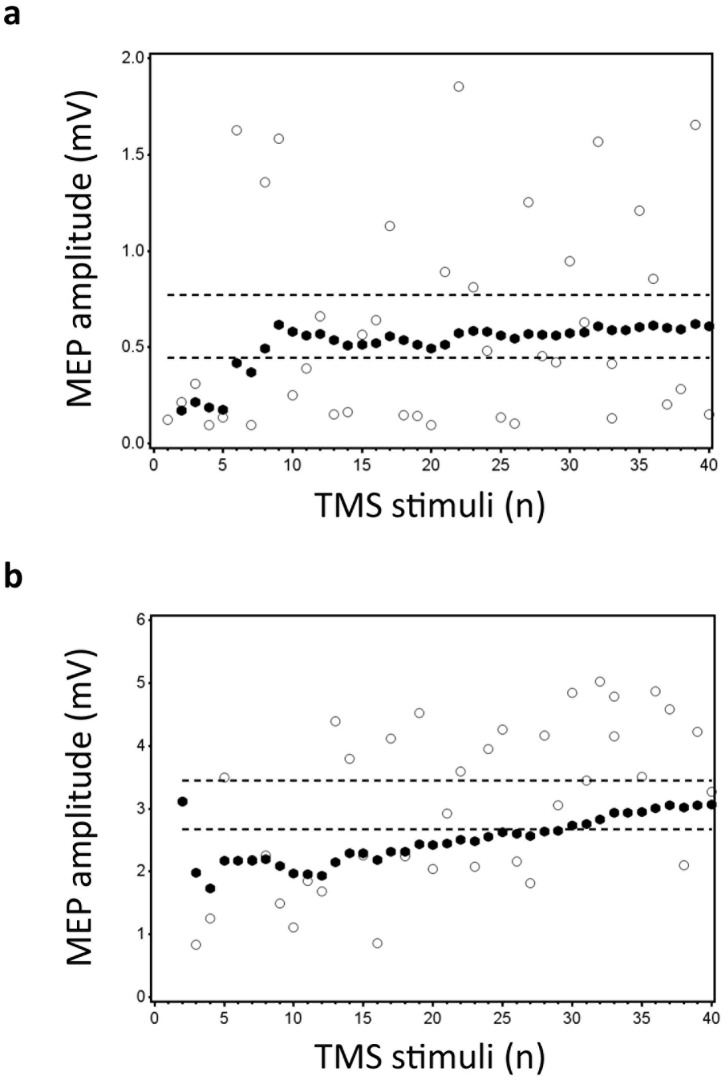
Figure 1. Data for subject 36 (a) and 34 (b) is illustrated.
The Y-axis shows the MEP amplitude (mV), while the number of TMS stimuli (n) is shown on the X-axis. White dots represent the individual (raw) MEPs, whereas the black dots represent the average of consecutive MEPs ( ). Dashed lines represent the 95% confidence interval (CI), which is based upon all 40 stimuli. The upper panel (a) illustrates data that was included in the statistical analysis (slope estimate: 0.007; p = 0.355). For this particular subject, 8 consecutive stimuli were sufficient to enter the CI. The lower panel (b) shows data that has been excluded due to a significant change in slope over time (slope estimate: 0.062; p<0.001).

