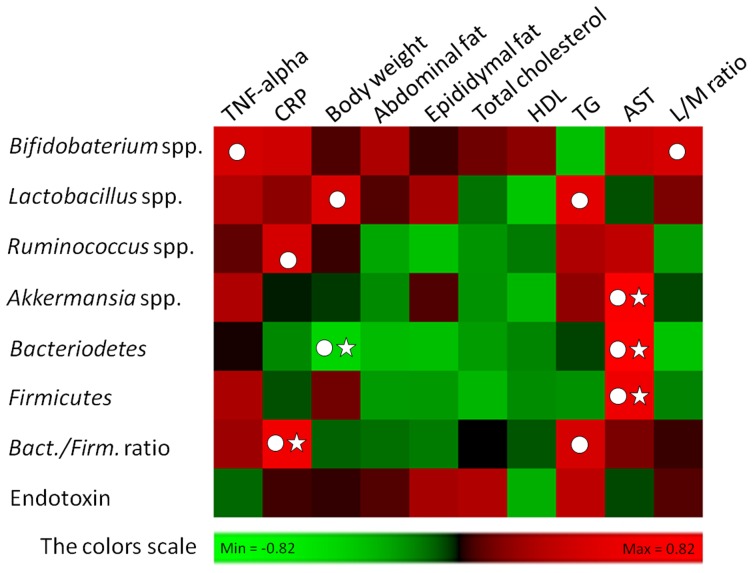
Figure 10. Analyses of correlation between gut flora composition and host metabolic parameters.
The entire data of all experimental groups except normal were gathered and analyzed by SPSS software (17.0 version) using two-tailed Pearson’s correlation test. The scores of Pearson’s correlation were figured by PermutMatrix software (Version 1.9.3 EN) using heatmap plots. As the colors scale shown, green color indicates a positive correlation, while red color shows a negative correlation. (A symbol of ○ indicates absolute value of Pearson r >0.4; a symbol of ☆ indicates statistical significance of P<0.05).

