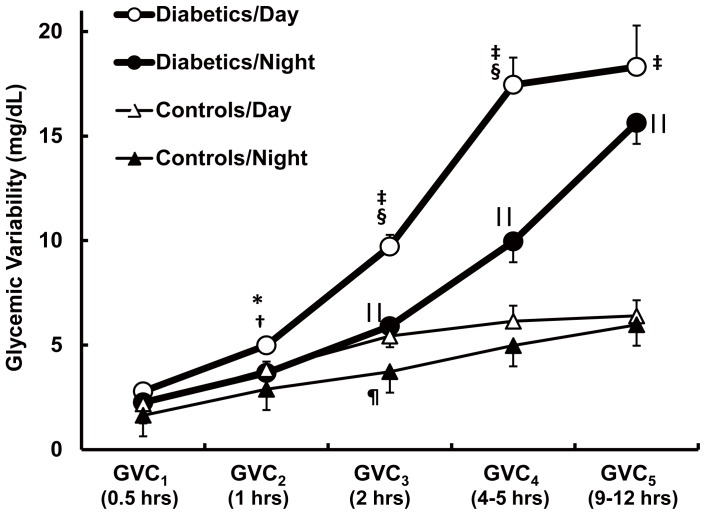
Figure 2. Day and night Multi-Scale Glycemic Variability in older adults with and without type 2 DM As compared to controls, the type 2 DM group had greater variability during the day in GVC2–5, and night GVC3–5.
At night, glycemic variability declined in type 2 DM in GVC2–4 and in controls in GVC3. ‘*’ (P = 0.002) and ‘‡’ (P<0.0001) indicate significant differences between diabetics/day and controls/day; ‘∥∥’ (P<0.0001) indicates significant differences between diabetics/night and controls/night; ‘†’ (P = 0.003) and ‘§’ (P<0.0001) indicates significant differences between diabetics/day and diabetics/night; ‘¶’ (P = 0.028) indicates significant difference between control/day and control/night. All the P values were obtained by ANOVA. Results are presented as mean ± SEM.

