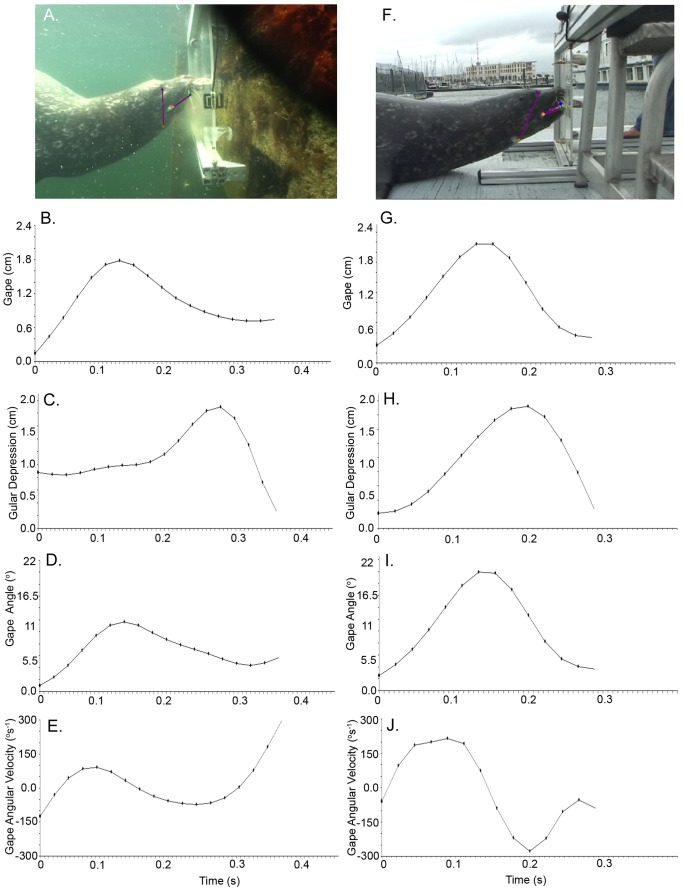
Figure 2. Representative Kinematic Profiles of Suction vs. Biting.
A. Frame from video during in-water suction feeding trial with overlaid spatial model stick figure. B. Plot of Gape (cm) for a single suction feeding trial. C. Plot of Gular Depression (cm) for a single suction feeding trial. D. Plot of Maximum Gape Angle (degrees) for a single suction feeding trial. E. Plot of Gape Angle Velocity (degrees/s; opening and closing) for a single suction feeding trial. F. Frame from video during on-land biting feeding trial with overlaid spatial model stick figure. G. Plot of Gape (cm) for a single biting feeding trial. H. Plot of Maximum Gape Angle (degrees) for a single biting feeding trial. I. Plot of Gular Depression (cm) for a single biting feeding trial. J. Plot of Gape Angle Velocity (degrees/s; opening and closing) for a single biting feeding trial.

