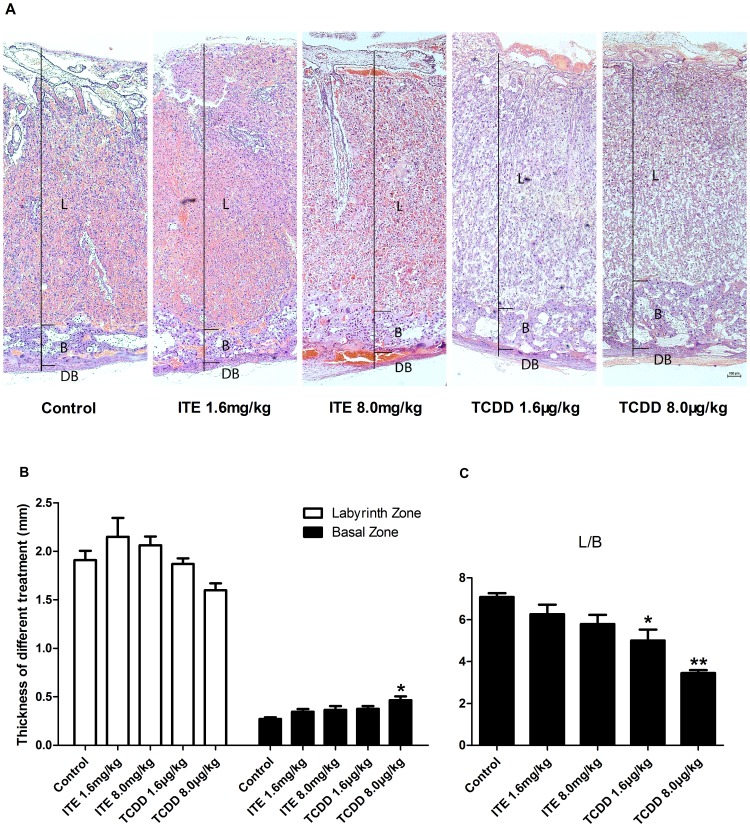
Figure 3. Effects of ITE and TCDD on placental morphology.
A. HE staining for rat placentas (L, labyrinth zone; B, basal zone; DB, decidua basalis). Bar, 100 µm. B. Quantification of thickness of the labyrinth and the basal zone. C. Ratio of the labyrinth zone to the basal zone. *Differ from the control (p<0.050), **differ from the control (p<0.001; n = 5/group). Data are expressed as means ± S.E.M.

