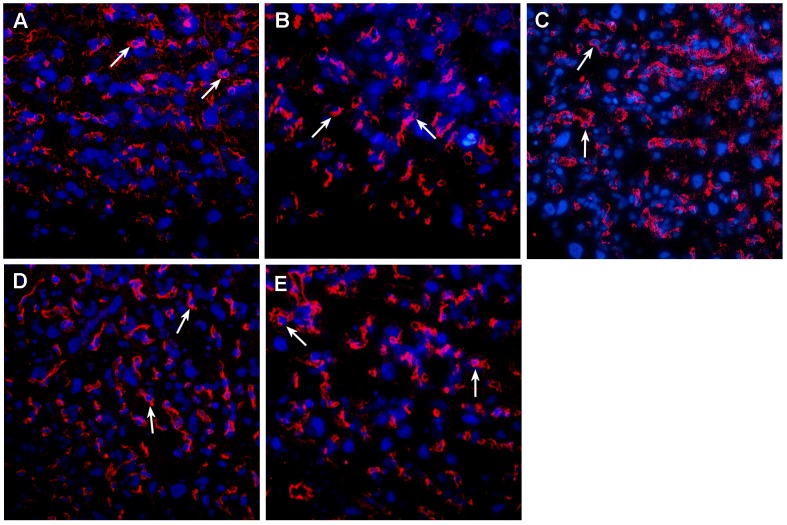
Figure 5. Expression of CD31 in the placental labyrinth zone from the control (A), 1.6 mg/kg bw ITE (B), 8.0 mg/kg bw ITE (C), 1.6 µg/kg TCDD group (D) and 8.0 µg/kg TCDD group (E).
The tissue sections were probed with CD31 and countered with DAPI. Arrows indicate fetal capillaries in the trophoblastic septa. Magnification×200.

