
Figure 2. Force spectroscopy of α-synuclein monomers.
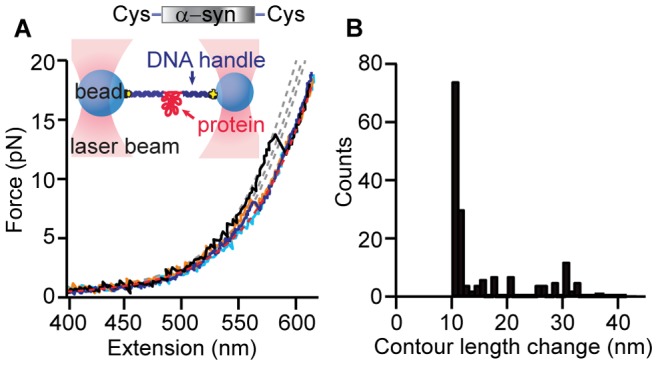
(A) Inset: A single protein molecule was attached at its ends to DNA handles, bound to beads and held under tension between two optical traps. Most FECs of a single monomer display no structure (cyan) and fit well to the WLC model expected for the unfolded-state (red). Some reveal discrete unfolding transitions (black, orange, blue) with different contour lengths, as found from WLC fits (grey). (B) Histogram of ΔL c for all identifiable transitions in FECs of the monomer.