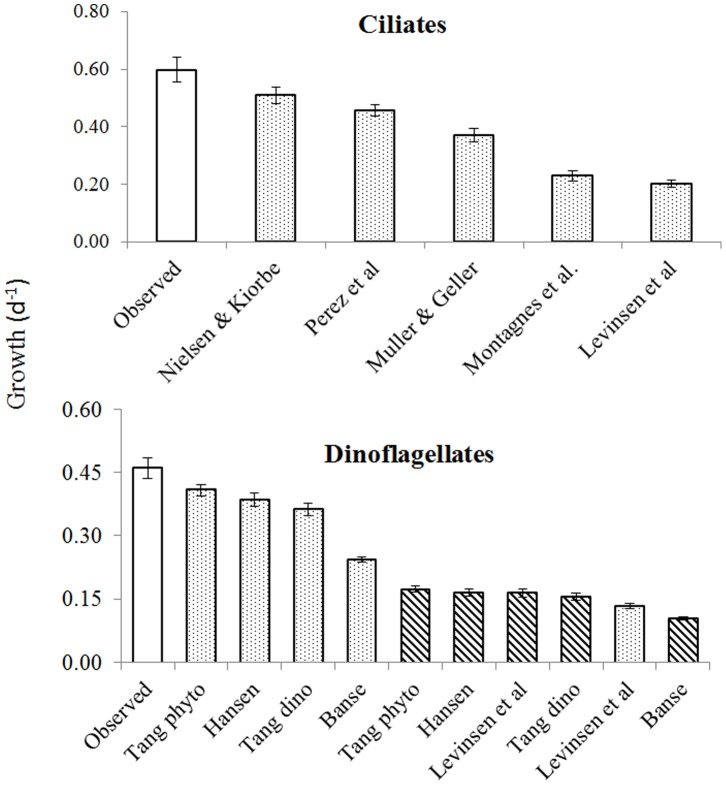
Figure 5. Comparison of the average observed and predicted growth rates.
The equations used for growth rate calculations are presented in Table 2. Open bars indicate observed rates, striped bars indicate calculated rates corrected using Q10 = 2.8, dotted bars show Q10 = 1.58.

