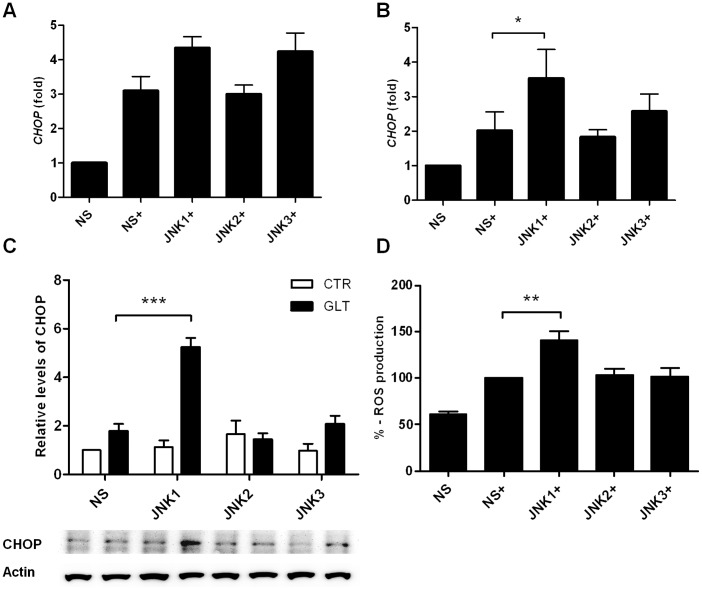
Figure 4. JNK1 knockdown increases CHOP expression and ROS formation.
INS1 cells stably expressing shRNA directed against JNK1, JNK2, JNK3 or the non-sense (ns) control were exposed to 0.5 mM palmitate and 25 mM glucose for 12–24 h (+). Relative mRNA expression was measured using quantitative RT-PCR and normalized to Hprt1. Relative CHOP mRNA expression at A: 12 h, B: 16 h. C: Protein was isolated from JNK1, 2 or 3 shRNA expressing INS1 cells after 24 h of 0.5 mM palmitate and 25 mM glucose exposure. CHOP levels were analyzed by Western blotting. Actin was used as the loading control, representative blots are shown. Data are shown with ± SEM of five - six independent experiments D: ROS production was measured by a fluorophore probe as described in the methods section. JNK1, JNK2, JNK3 or non-sense (ns) shRNA expressing INS1 cells were exposed to palmitate and high glucose for 24 h and fluorescent signal was normalized to ns (100%). Data are shown+SEM of four independent experiments. *P<0.05, **P<0.01, ***P<0.001.

