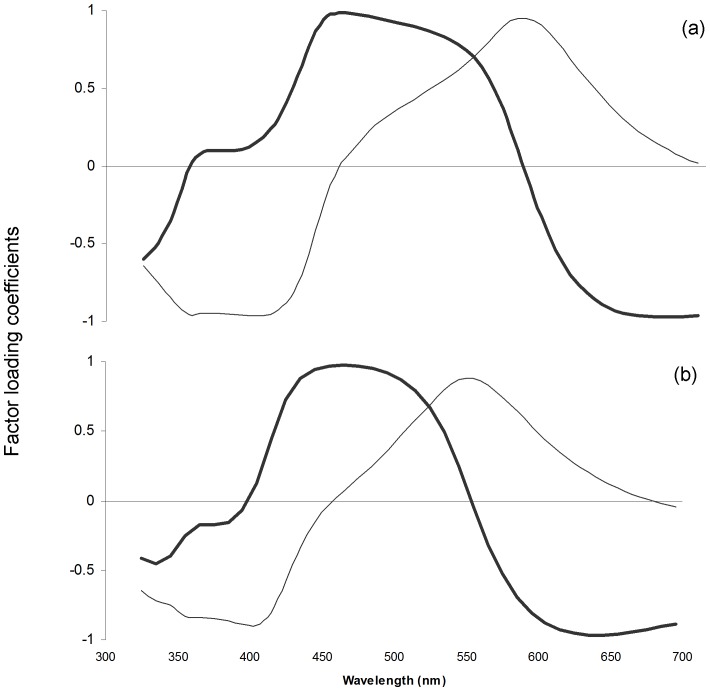
Figure 1. Association between principal component factor loading coefficients for PC1 (thick lines) and PC2 (thin lines).
Coefficients are given for (a) C-females (n = 16) and T-females (n = 16; week10: n = 15) before implantation and one, two, three, four, five and ten weeks after implantation and (b) C- and T-females ten weeks after implantation (nC = 16, nT = 15) and untreated males (n = 40).

