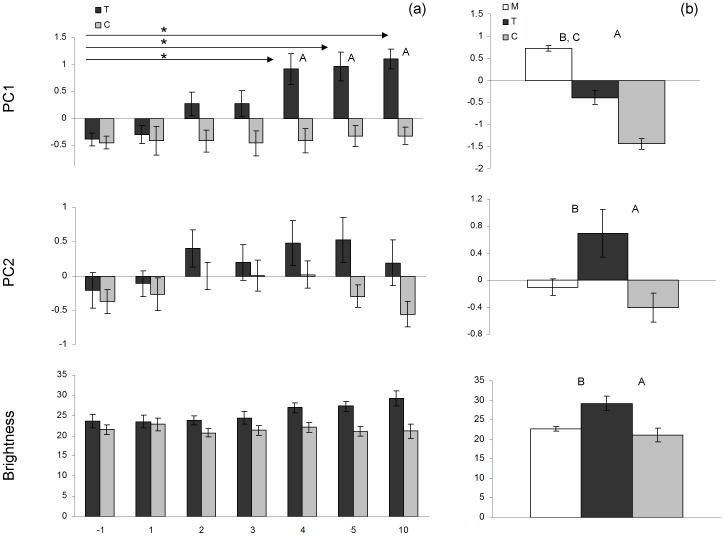
Figure 3. Mean ± SE principal component scores and brightness.
PC1 represents blue wavelength reflectance and PC2 represents UV reflectance. Scores are given for (a) C-females (n = 16, gray bars) and T-females (n = 16; week10: n = 15, black bars) before implantation and one, two, three, four, five and ten weeks after implantation (asterisks (*) indicate significant differences between measurements for T-females, P<0.05) and (b) untreated males (n = 40, open bars) and T-females (n = 15, black bars) and C-females (n = 16, gray bars) ten weeks after implantation. (letters above histograms indicate significant differences between bird categories, P<0.05; A: difference between T- and C-female, B: difference between T-female and male, C: difference between C-female and male).

