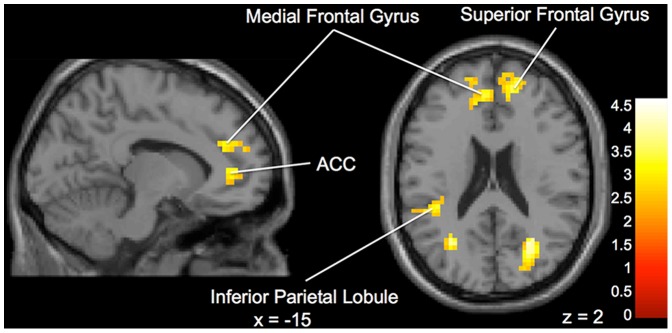
Figure 3. Brain activation for statistical contrast maps NOT OBEDIENT – OBEDIENT.

“Expert” group shows increased activation compared to “Peer” group in the ACC, medial frontal gyrus and superior frontal gyrus. “z” and “x” coordinate provided at bottom right corners in MNI space. All results voxelwise statistical threshold at t = 2.0211 (p < 0.05) and a cluster threshold level of k = 201, p < 0.05 corrected for multiple comparisons.
