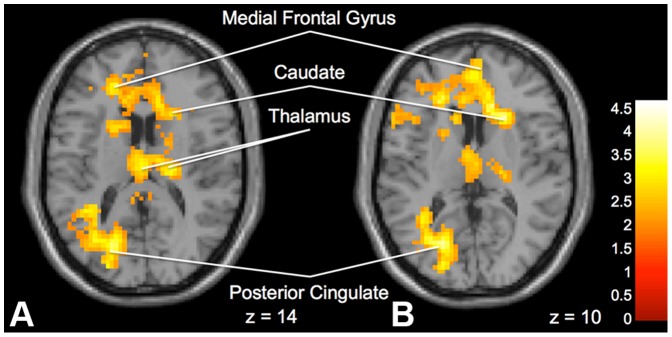
Figure 7. Brain activation for statistical contrast maps ADVICE – NO ADVICE and NO ADVICE – ADVICE.

a. “Peer” group shows increased activation compared to “Expert” group in the posterior cingulate, medial frontal gyrus and caudate in the ADVICE – NO ADVICE comparison. b. “Expert” group shows increased activation compared to “Peer” group in the posterior cingulate, medial frontal gyrus, caudate and thalamus in the NO ADVICE – ADVICE comparison. “z” coordinate provided at bottom right corners in MNI space. All results voxelwise statistical threshold at t = 2.0211 (p<0.05) and a cluster threshold level of k = 201, p<0.05 corrected for multiple comparisons.
