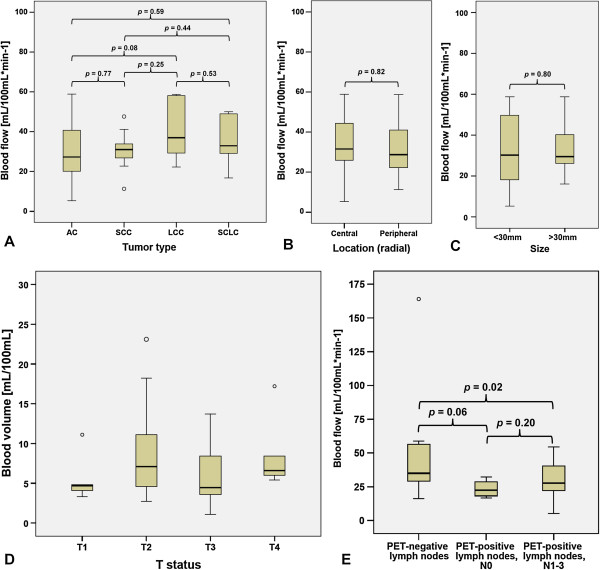
Figure 2.
Boxplots of CTP parameters, clinical tumor parameters, and 18F-FDG-PET/CT parameters. (A) BF in different tumor types. (B) BF according to radial location of tumor. (C) BF according to tumor size. (D) BV according to T status. (E) BF according to PET positivity of regional lymph nodes stratified by N status. PET-negative n = 17, PET-positive/N0 n = 4, PET-positive/N1 to N3 n = 25. Circle depicts outlier. BF, blood flow; BV, blood volume; CT, computed tomography; CTP, CT-perfusion; 18 F-FDG-PET/CT, 18F-fluoro-2-deoxy-d-glucose positron emission tomography/computed tomography; PET, positron emission tomography.

