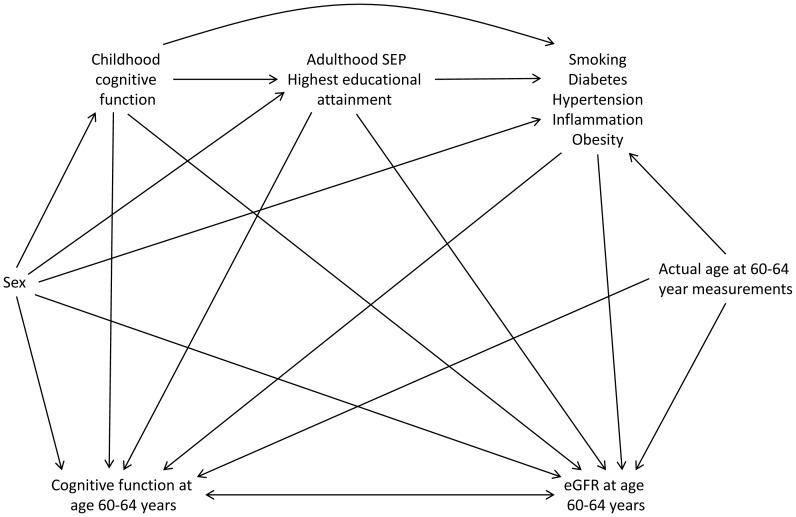
Figure 1. Causal diagram showing inter-relation of variables.
Arrows show the assumed direction of causal influence, with the double-headed arrow between cognitive function at age 60–64 years and eGFR at age 60–64 years indicating that we make no assumption about the direction of causality between these two variables. SEP, socio-economic position; eGFR, estimated glomerular filtration rate.

