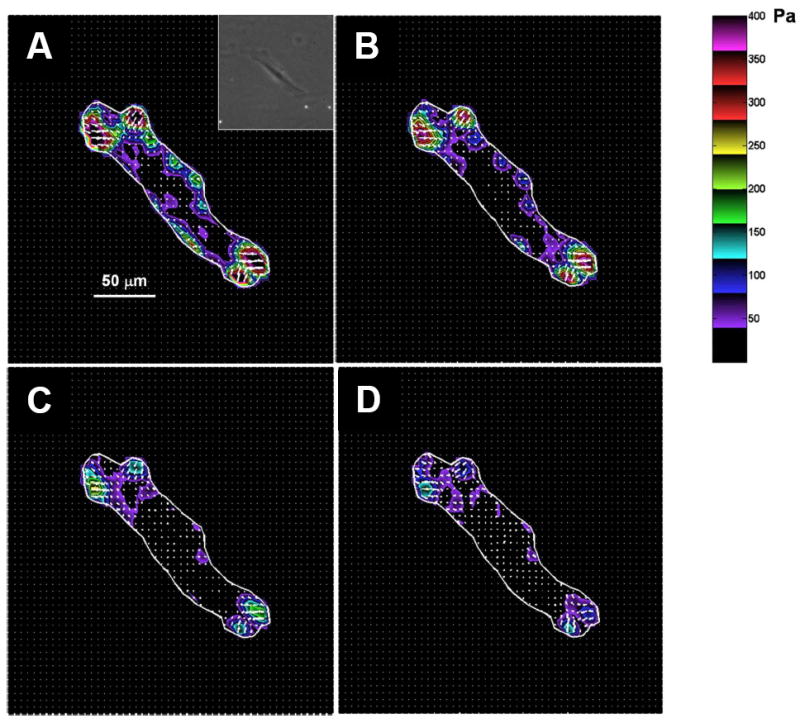
Figure 2. Airway smooth muscle cell exerts traction upon an elastic substrate.

A representative changes in traction field of a single airway smooth muscle cell in response to isoproterenol (A, 0 μM; B, 0.1 μM; C, 1 μM; D, 10 μM). The traction field was computed from the displacement field using Fourier transform traction cytometry (FTTC) (Butler et al. 2002; Tolic-Norrelykke et al. 2002; Wang et al. 2002). The cell boundary is shown by the white line. Colors show the magnitude of the tractions in Pascal (Pa) (see color scale). Arrows show the direction and relative magnitude of the tractions. In general, the greatest tractions are at the cell periphery and directed centripetally. Inset: A phase-contrast image of the respective airway smooth muscle cell. Scale bar, 50 μm.
