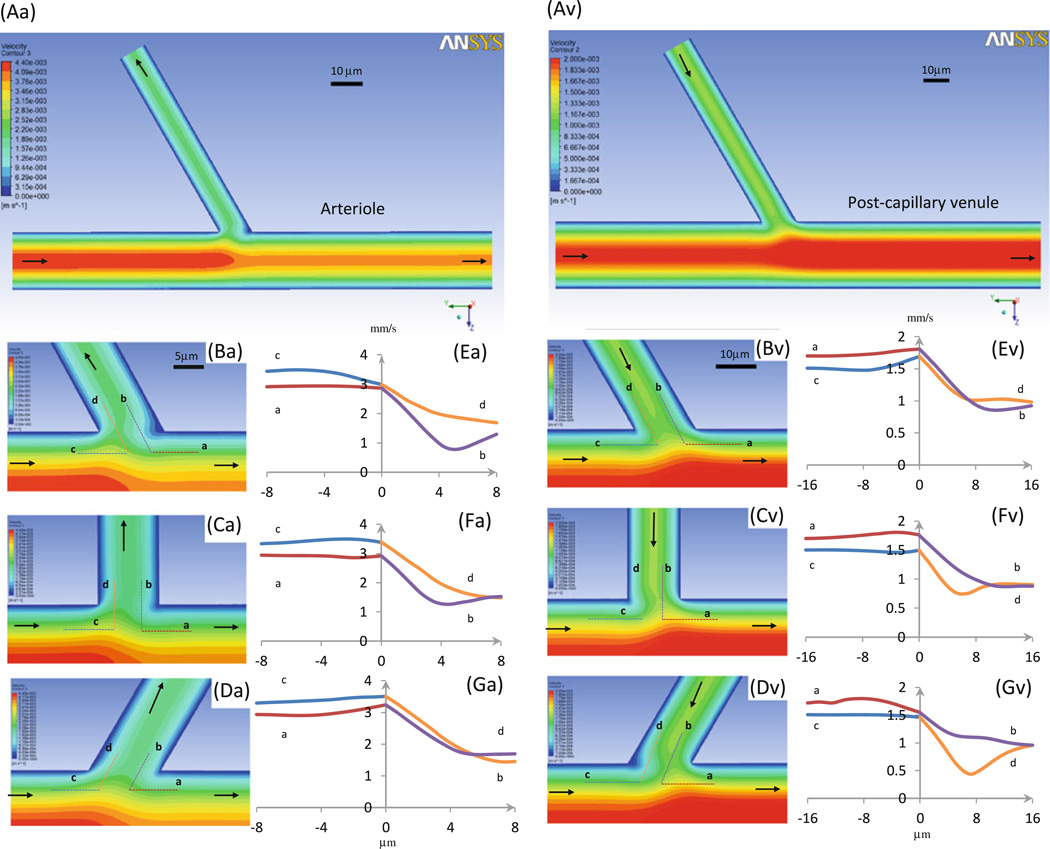
Fig. 6.
Velocity profiles in microvessels at intersections. Seven panels in left column: arteriole–capillary intersection; those in right column: side branch–postcapillary venule intersection. Aa and Av are velocity contour plots in midplane of vessels. Ba–Da and Bv–Dv are enlarged plots near intersectional region when branching angle θ is 60°, 90°, and 120°, respectively. Ea–Ga and Ev–Gv are detailed velocity profiles along dotted lines a (red), b (purple), c (blue), and d (orange) (in Ba–Da or Bv–Dv), which are 1/4 diameter distance from the vessel walls. Arrows: flow directions in microvessels

