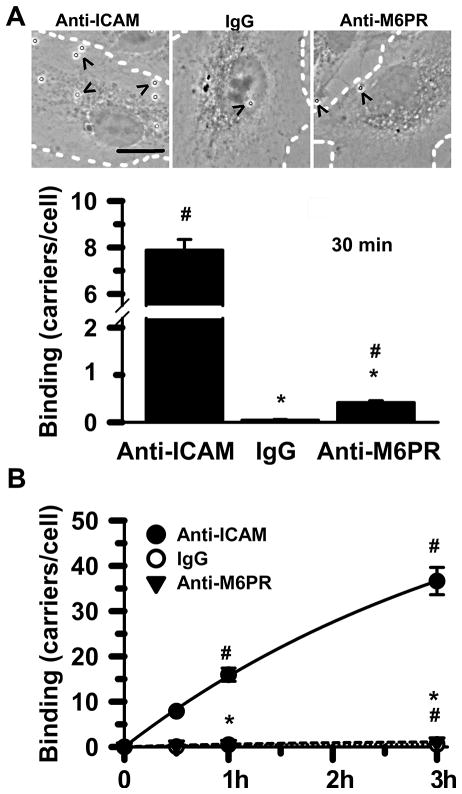
Figure 1. Comparative binding of carriers targeted to ICAM-1 vs. M6PR.
(A) Phase-contrast microscopy showing low, yet specific binding of 1-μm carriers coated with anti-M6PR compared to anti-ICAM carriers or control IgG carriers, after 30 min incubation at room temperature with fixed activated HUVECs. Dashed lines mark cell borders and arrowheads mark carriers. Scale bar = 10 μm. (B) Binding of these carriers to cells was similarly compared at 30 min, 1 h, and 3 h to reflect their relative binding kinetics. Mean ± standard error of the mean. *Compared to anti-ICAM carriers; #compared to control IgG carriers (p < 0.05).

