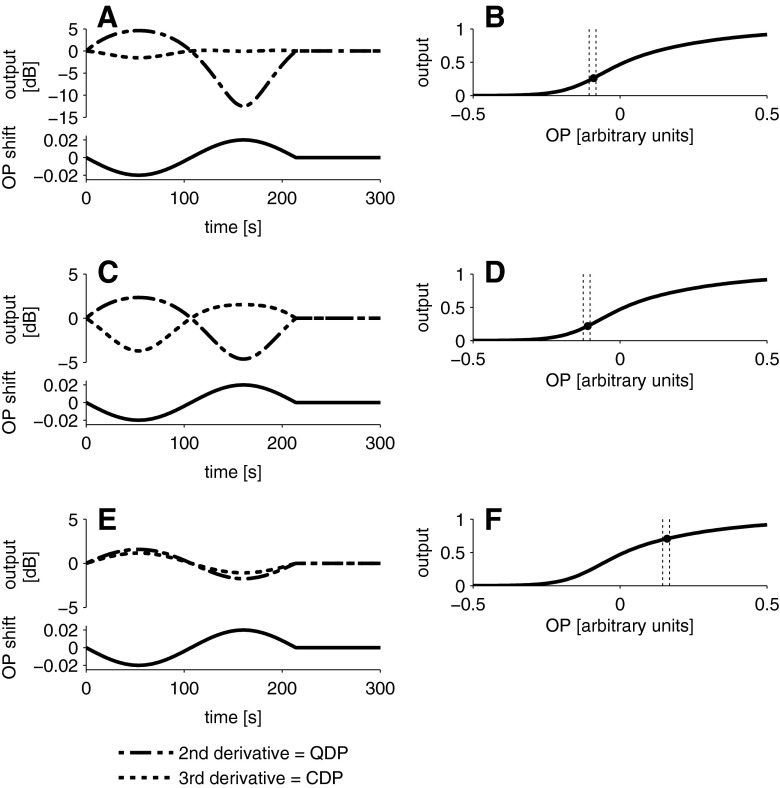
FIG. 3.
Simulation of the level change (relative to the mean of the pre-exposure period) of CDP and QDP as a function of sinusoidal OP changes. QDP levels change markedly while CDP remain almost unchanged (A, top panel) when the OP is moved sinusoidally (A, bottom panel) around an initial OP position (B, black symbol) near the inflection point of the Boltzmann function. QDP and CDP change with opposite sign (C, top panel) when the OP is sinusoidally changed (C, bottom panel) around an initial OP position further away from the inflection point (D). QDP and CDP change with the same sign (E, top panel), when the OP is changed sinusoidally (E, bottom panel) around an initial OP position far away from the inflection point (F). Dashes lines in B, D and F indicate the range of the OP shift. See also Fig. 1 for the behaviour of QDP and CDP levels as a function of OP shifts.

