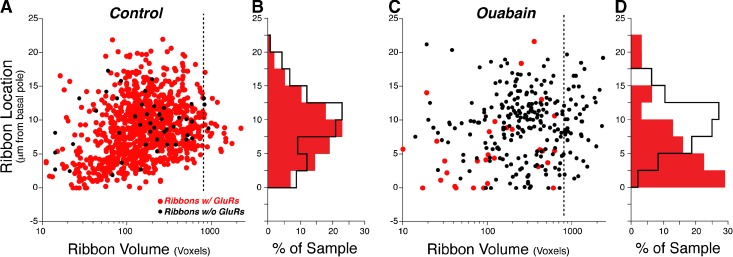
Fig. 7.
After ouabain treatment, many IHC ribbons are larger than normal, and most remaining synapses are close to the basal pole of the IHC. Spatial analysis of the synaptic elements derived from 62 IHCs from 3 control ears (A, B) versus 95 IHCs from 5 ears examined 1 month after ouabain treatment (C, D). The scatter plots (A, C) show ribbon position versus ribbon volume (in voxels), with orphan ribbons shown in black. Ribbon position is extracted from image stacks acquired with the z-axis perpendicular to the basilar membrane and is defined as the distance (in z) from the ribbon closest to the basilar membrane. The dashed lines (at volume = 800 voxels) show the increased frequency of large ribbons after ouabain. The location histograms (B, D) are derived from their respective scatter plots (A, C) and express location as percent of sample. Color key in panel A applies to all panels. One voxel = 1.439 × 10⁶ nm3.

