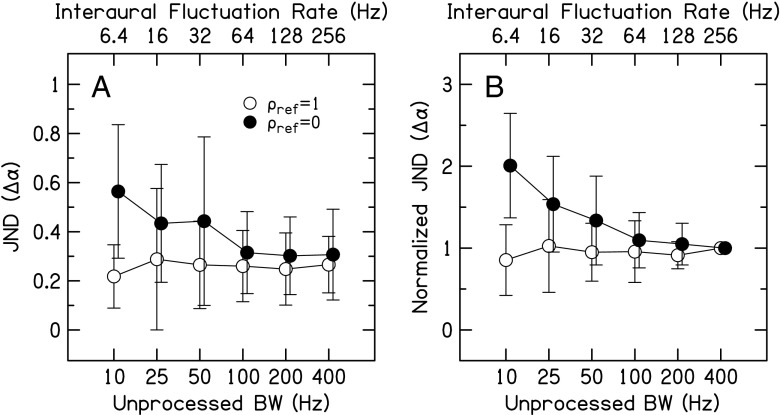
FIG. 4.
Correlation change JNDs for the pulse-train vocoded stimuli in Exp. 2 as a function of average interaural fluctuation rate (top axis) or unprocessed stimulus BW (bottom axis). A The average JNDs and B the average of normalized JNDs, where the individual-listener JNDs were normalized to the 256-Hz interaural fluctuation rate JND. Data points represent the arithmetic mean with error bars that are ±1 standard deviation in overall length.

