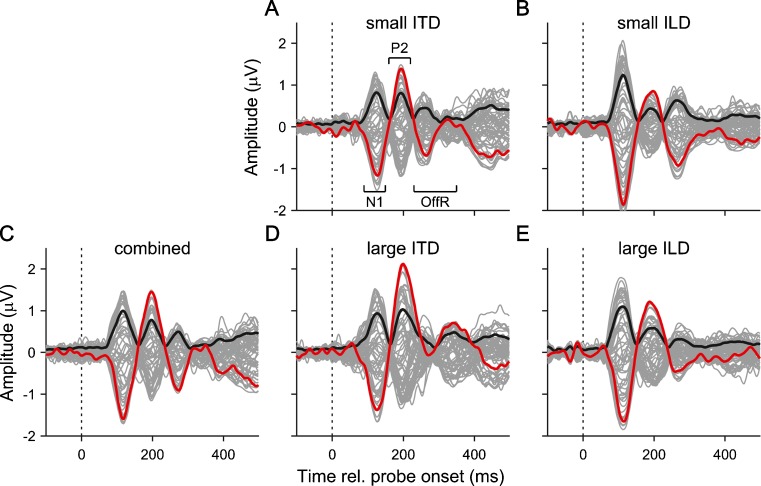
FIG. 3.
A–E Grand average EEG responses to all stimulus conditions plotted as a function of time relative to probe onset. As in Figure 1C, the thin grey lines show the signals from the 64 recording channels, the red lines show the vertex channel and the solid black lines show the GFP of the response. The dashed vertical lines mark the probe onset.

