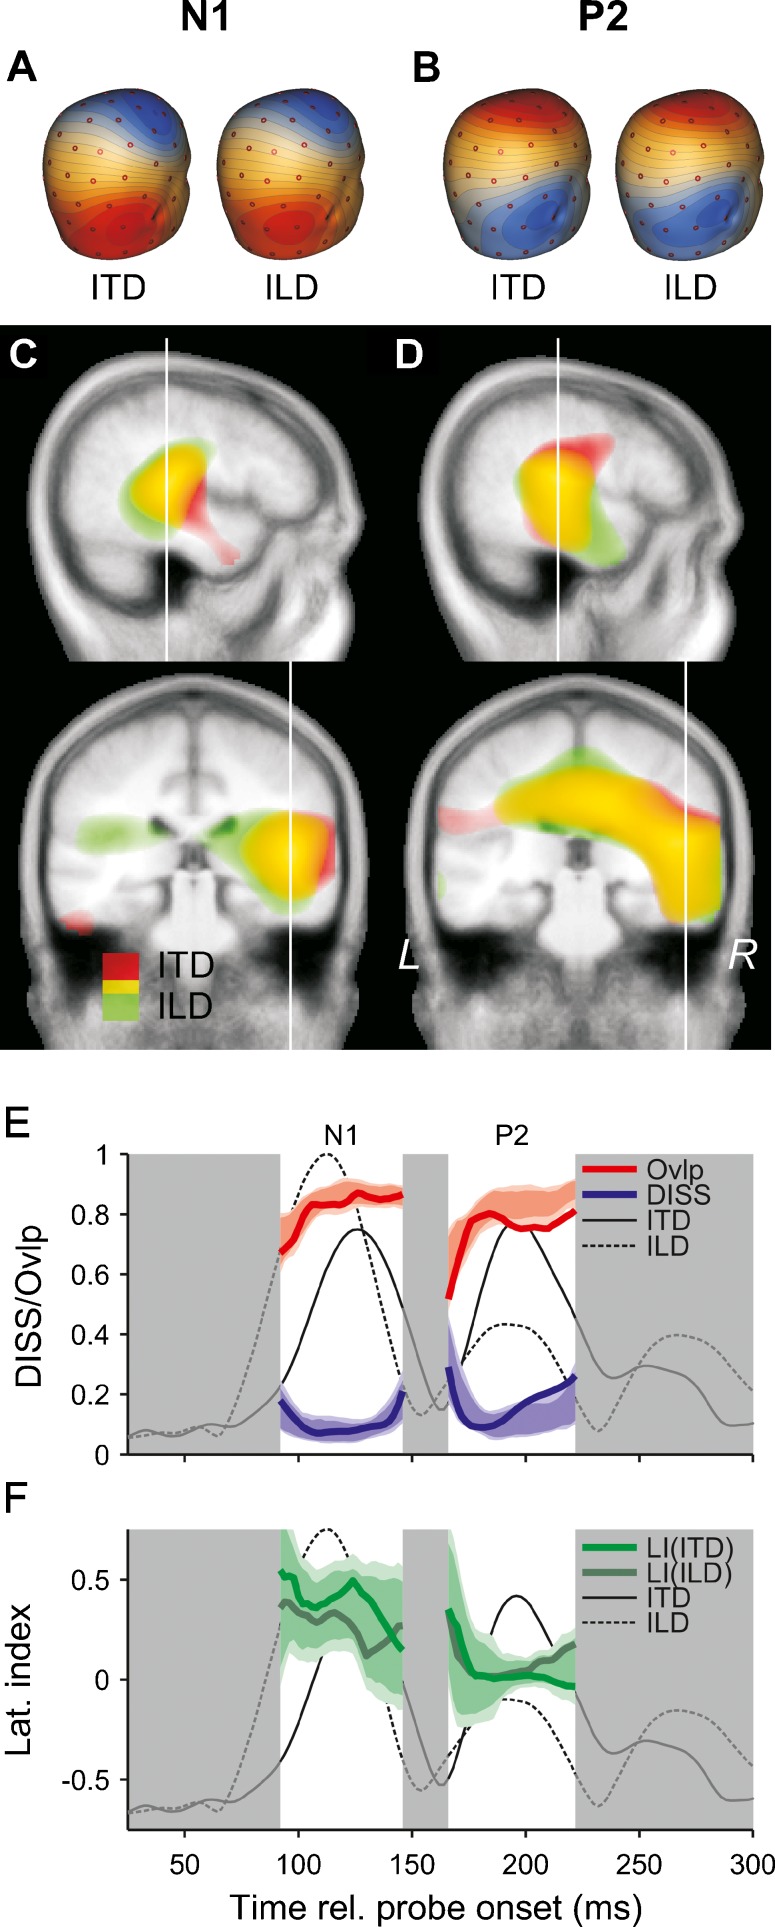
FIG. 5.
Comparative source analysis of average ITD- and ILD-only responses. A, B Scalp voltage maps of the N1 (A) and P2 (B) deflections in the ITD- (left) and ILD-only (right) responses. The maps were taken from the middle of the rising flank of the respective deflection (106 ms for the N1 and 180 ms for the P2). C, D Distributed source estimates based on the scalp maps shown in A and B, projected onto right sagittal (top) and coronal (bottom) slices of a Talairach average brain. The source distributions for the ITD and ILD responses are superposed, with the red highlight showing the distributions for the ITD response and the green highlight showing the distributions for the ILD response; the yellow highlight shows where the two distributions overlap. C The source distributions for the N1, and D for the P2. The thin, white lines show the slice positions. E Global dissimilarity (DISS) between the scalp maps (bold, blue lines) and spatial overlap (Ovlp) between the source distributions (bold, red lines) of the ITD- and ILD-only responses, calculated within the time ranges of the N1 and P2 (highlighted by the white background). The Ovlp was expressed as a proportion of the average total volume of each distribution. The thin, solid and dashed lines show the GFP of the ITD- and ILD-only responses, scaled to the maximum of the ILD-only response. Note that the DISS increases as the response amplitude decreases towards the edges of the N1 and P2 time ranges, because the scalp maps become dominated by noise. The blue- and red-shaded areas represent the null distributions of the DISS and Ovlp, based on 512 permutation samples. The darker shading shows the 5–95 and the lighter shading the 1–99 percentile ranges of the distributions. F Hemispheric lateralization indices (LIs) of the ITD- (bold, light-green lines) and ILD-only responses (bold, dark-green lines). The green-shaded areas represent the null distributions of the difference between the LIs for the ITD and ILD conditions, shifted to center on the average LI between the ITD and ILD conditions. Again, the darker shading shows the 5–95 and the lighter shading the 1–99 percentile ranges.

