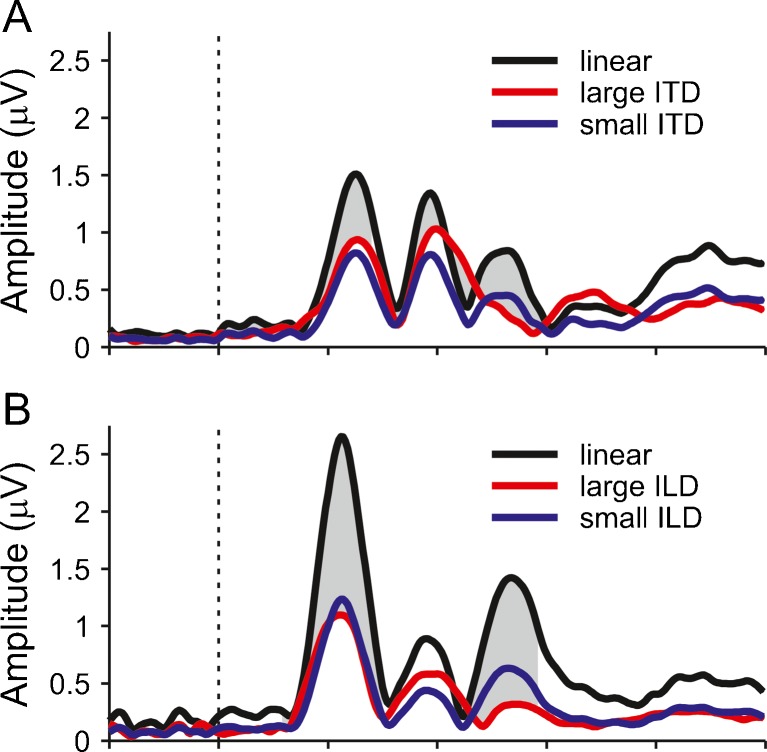
FIG. 8.
A GFP of grand average responses to the small (blue) and large (red) ITD responses. The black line shows the large ITD response that would have been expected, if the response size scaled linearly with the perceived lateralization. It was derived by multiplying the small ITD response with the average ratio between the large and small ITDs (see Fig. 2). The grey shading marks the time points where the GFP of the difference between the expected and actual responses to the large ITD was significantly different from zero. B The same analysis for the ILD conditions.

