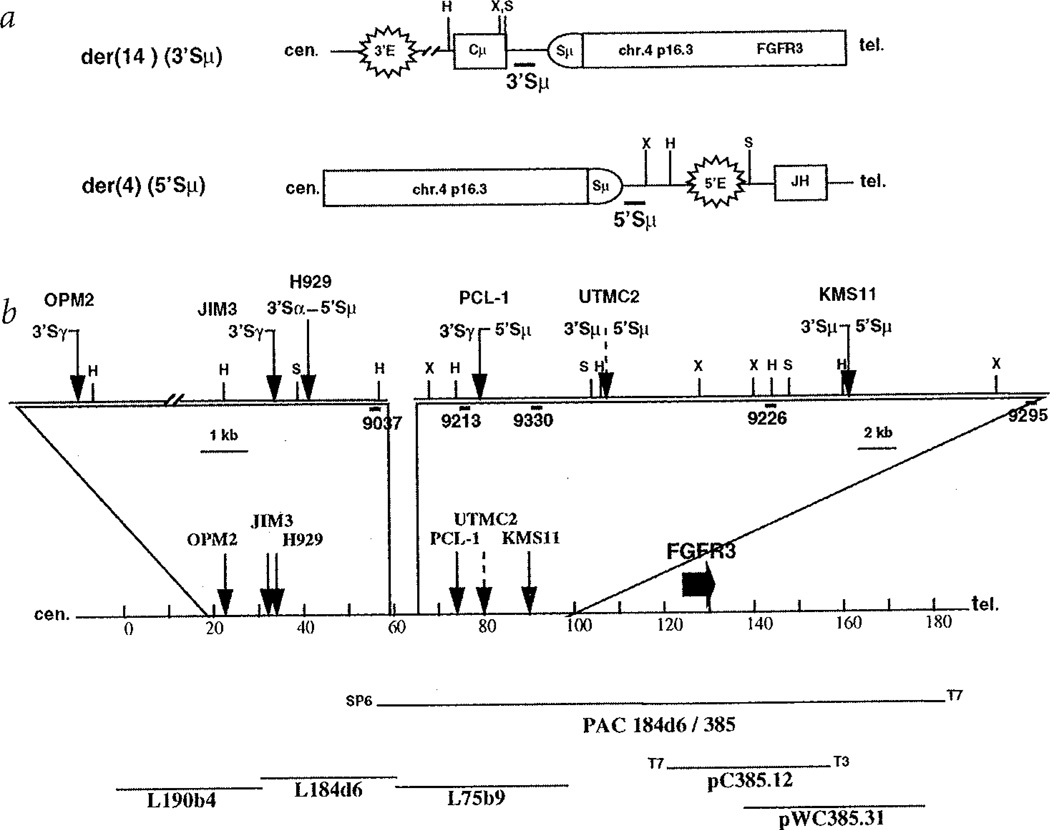
Fig. 1.
Translocation breakpoints involving 4p16.3. a, Diagram of der(14) and der(4) breakpoints resulting from a translocation into Sµ. The centromere is to the left, and the figure is not to scale. Structural elements include enhancers (3'E and 5'E), switch region (Sµ) and coding segments (Cµ and JH). Thick horizontal lines depict 3'- and 5'Sµ probes. Vertical lines represent restriction enzyme sites, X = XbaI, H = HindIII, S = SphI. b, Distribution of 4p16.3 breakpoints within the distal 70 kb of a 2-Mb cos-mid contig spanning the Huntington's disease region, centromeric to the FGFR3 gene. The diagram is drawn to scale. Solid arrows indicate the positions of the cloned breakpoints for the OPM2, JIM3, H929 and KMS11 myeloma cell lines and for the tumour sample (PCL-1), while a dashed arrow shows where the breakpoints for UTMC2 have been mapped by Southern-blot analysis. Next to each arrow is indicated the type and orientation of the switch region associated with the breakpoint; the shaded designation indicates breakpoints determined by Southern blotting. The sites of restriction enzymes, indicated by a capital letter (H for HindIII, S for SphI, X for XbaI), as well as the position of the probes, indicated by thick lines, used for cloning the breakpoint or for Southern-blot analysis are depicted in the enlarged sections. The entire sequence (except for three short gaps in L75b9) of the most distal cosmid contig (L190b4, L184d6 and L75b9) in the Hunting-ton's disease region is known. The transcription orientation of FGFR3 gene is from the T7 end to the T3 end of pC385.12 (M.R. Alther, pers. comm.r).

