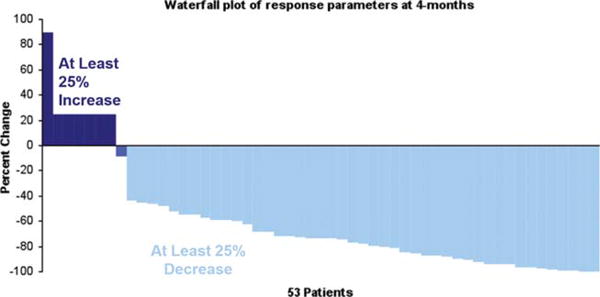
Figure 1.

Figure presents the actual decrease in the M-protein measurements as a proportion of the baseline values using a waterfall plot of response depth at the end of four cycles of therapy. [Color figure can be viewed in the online issue, which is available at wileyonlinelibrary.com.]
