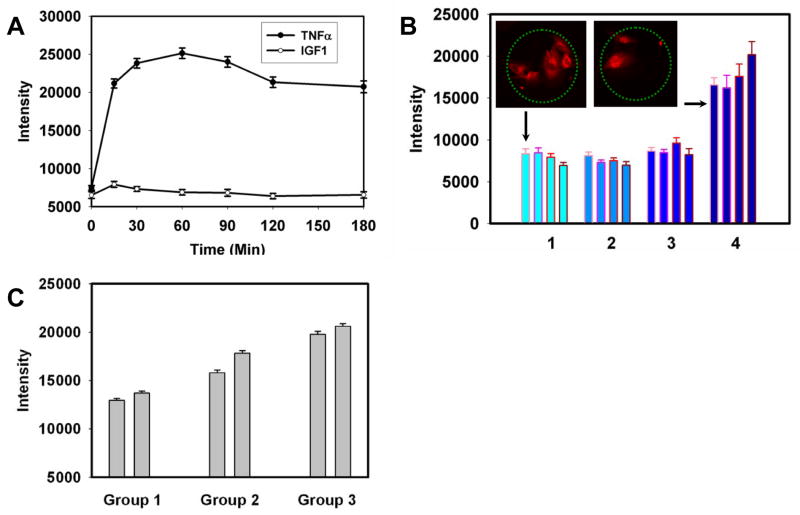
Figure 4.
Stimulation of the NF-κB pathway by printed TNFα and IGF1 in iHUVECs. A: Time courses of NF-κB stimulation in iHUVECs by a 10 ng/ml TNFα (filled circles) and 10 ng/ml IGF1 added to the cell medium. The fluorescence intensity values represent in arbitrary units the amount of NF-κB in cell nuclei measured by immunostaining using an anti-p65 antibody (approximately 60 cells were measured for each data point). Error bars represent the standard error of the mean; B: Stimulation of NF-κB by TNFα and IGF1 printed onto the glass cell adhesion substratum. In groups 1 to 4, the coating TNFα concentration changes 0, 2, 10 to 50 μg/ml, while within each group, the coating IGF1 concentration increases 0, 2, 10 to 50 μg/ml from left to right (approximately 30 cells were measured for each data point). Florescence intensities are as in (A). Error bars indicate the standard error of the mean. The insets show typical images of the p65 staining in cells captured on the protein spots corresponding to the indicated conditions (minimal and maximal coating TNFα and IGF1 concentrations). C. Stimulation of NF-κB by TNFα and IGF1 dissolved in the cell medium. From group 1 to 3, TNFα increased as 0,0.1 to 1 ng/ml, while within each group, IGF1 concentration increased from 0 (left) to 10 ng/ml (right).

