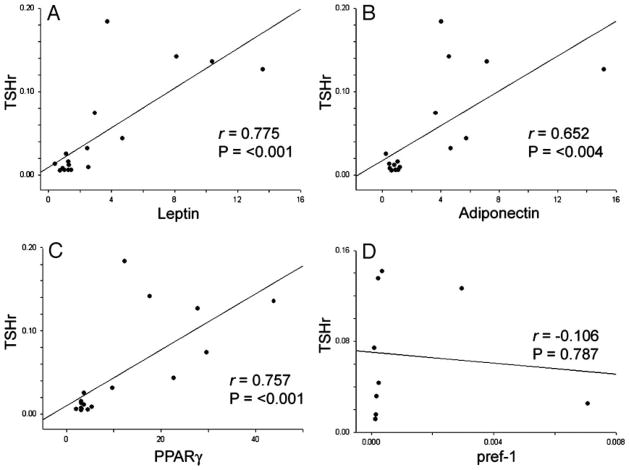
Fig. 2.
Correlations between TSHr mRNA and levels of mRNA encoding adipogenesis-related genes (normalized to 18S rRNA) in orbital adipose tissues from patients with GO. A, Leptin (n = 17); B, adiponectin (n = 17); C, PPAR-γ (n = 17); D, pref-1 (n = 10). Correlation coefficients and P values are included in each graph.

