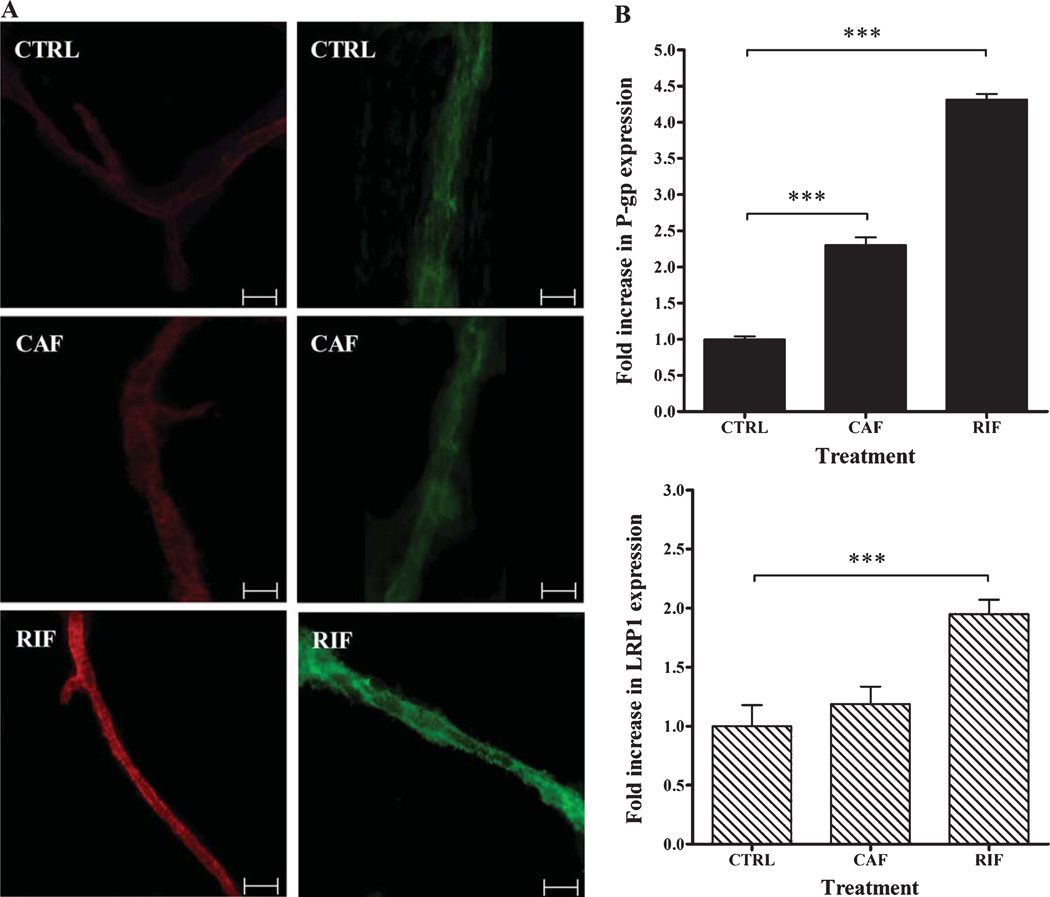
Fig. 3.
Immunohistochemical analyses of P-gp (red, left micrographs) and LRP1 (green, right micrographs) in brain microvessels of C57BL/6 wild-type mice following rifampicin (RIF), caffeine (CAF), and vehicle (CTRL) treatments. Rifampicin and caffeine significantly upregulated P-gp expression compared to control group, while significant upregulation of LRP1 was only observed in rifampicin group. A) Representative fluorescent micrographs of P-gp (red, left micrographs) and LRP1 (green, right micrographs) for control, caffeine and rifampicin treated groups. B) Quantitative fold increase in P-gp (upper panel) and LRP1 (lower panel) expressions. The data are expressed as mean±SEM of n = 3 independent experiments (***p < 0.001). The white scale bar indicates 50 µm length.

