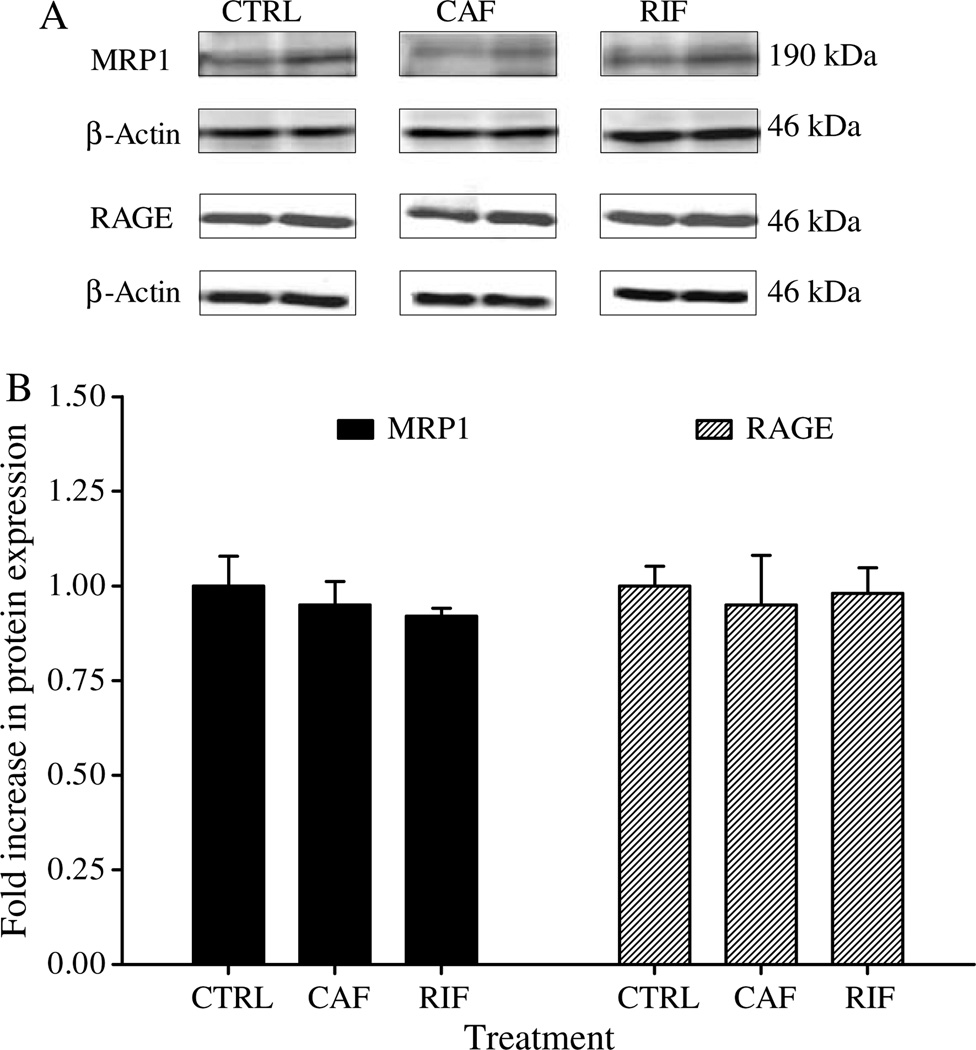
Fig. 4.
Western blot analysis of RAGE and MRP1 in brain microves-sels of C57BL/6 wild-type mice. Insignificant differences were observed in the expression level of both proteins in rifampicin (RIF), caffeine (CAF), and control (CTRL) treated mice. A) Representative western blot lanes for MRP1, RAGE, and protein loading control (β-actin). B) Quantitative fold increase in MRP1 and RAGE expressions. The data are expressed as mean ± SEM of n = 3 independent experiments.

