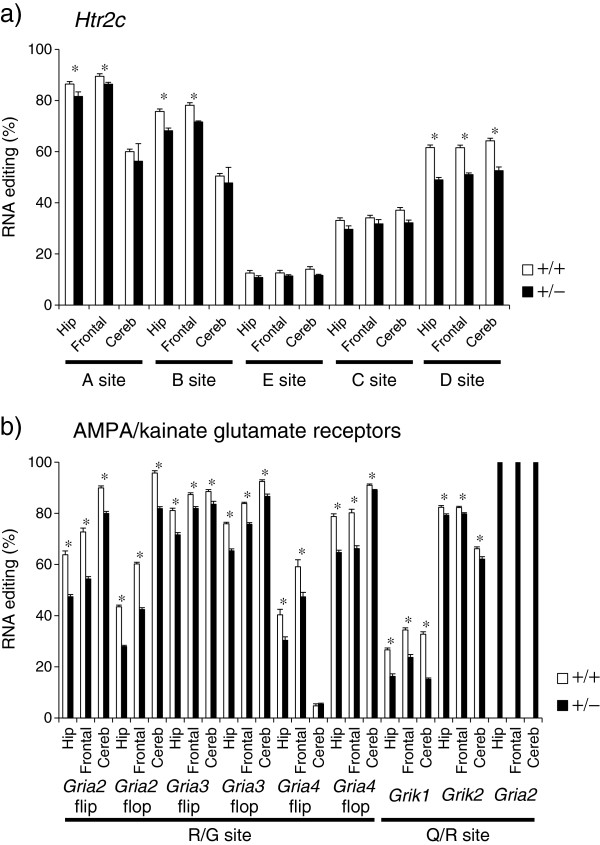
Figure 1.
RNA editing of Htr2c and AMPA/kainate glutamate receptors in Adar2+/− mice. a) Htr2c. b) AMPA/kainate glutamate receptors. P < 0.05 by Student t-test. Hip denotes hippocampus, Frontal denotes frontal cortex, and Cereb denotes cerebellum. White bars indicate the WT mice, black bars indicate the Adar2+/− mice. Data represent mean and error bars indicated by standard errors (n = 10 for each genotype).

