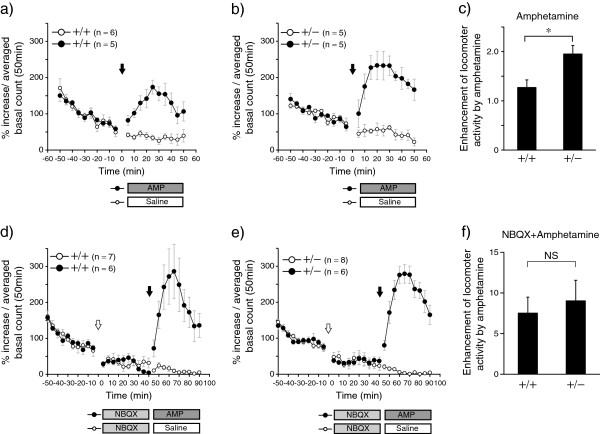
Figure 4.
Effects of amphetamine with or without NBQX pre-treatment on locomotor activity in Adar2+/− mice. a,b) Effect of amphetamine on locomotor activity in the WT mice (a) and the Adar2+/− mice (b). The horizontal axis indicates the time before and after administration of amphetamine or saline. The vertical axis indicates the activity level. Each dot represents the averaged activity level during the 5-min period. Closed circles indicate amphetamine-injected group and open circles indicate saline-injected group. Arrow indicates the time of drug administration. c) The vertical axis indicates the fold change of the averaged activity level during 50 min after the administration of amphetamine to the averaged activity during 50 min before the treatment. *P = 0.05 by Student t-test. d,e) Effect of NBQX on amphetamine-induced hyperactivity in the WT mice (d) and the Adar2+/− mice (e). The horizontal axis indicates the time before and after the administration of amphetamine or saline. The vertical axis indicates the activity level. Each dot represents the averaged activity level during the 5-min period. Closed circles indicate the amphetamine injected group and open circles indicate the saline-injected group. Arrows indicate the time of drug administration. The open arrow indicates the administration of NBQX and the closed arrow indicates the injection of amphetamine or saline. f) The vertical axis indicates the fold change of the averaged activity level during 50 min after the administration of amphetamine to the averaged activity during the middle 50 min after the NBQX treatment. No significant difference was found between genotypes. Data represent mean and error bars indicated by standard errors.

