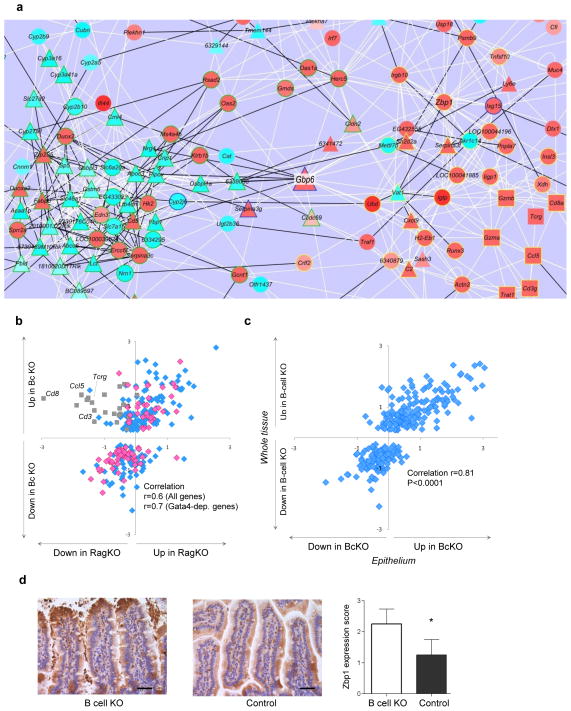
Figure 5.
Increased immune and decreased metabolic state of epithelium in BcKO mice. (a) Gene expression network of BcKO profile reconstructed from the data of control mice (zoomed in to the central part of the network; the whole network is in Supplementary Fig. 5a). Each line represents a correlation, and each node represents a gene. White lines are positive and black are negative correlations; triangles are Gata4-dependent genes, squares are the T cell genes and circles are all other genes; red node fills indicate upregulation, and light blue fills are downregulation; green node outline is a subnetwork 1, yellow is a subnetwork 2, and unoutlined node symbols do not belong to either of the two subnetworks. (b) Gene expression ratios between BcKO versus control (y axis; n = 27 per group) and between RAGKO versus control (x axis; n = 8 per group) mice. Each symbol represents one gene. Grey squares are T cell–related genes. Pink diamonds are Gata4-dependent genes; blue are all other genes. (c) Gene expression ratios between gut whole tissue of BcKO versus control mice (y axis; n = 27 per group) and between intestinal epithelium of BcKO versus control mice (x axis; n = 3 per group). Each symbol represents one gene. (d) Immunohistochemistry for Zbp1 in jejunum of BcKO and control mice (n = 4 per group) and the results of semiquantitative blind evaluation (*P < 0.05; bars represent s.d.); scale bar, 40 μm.

