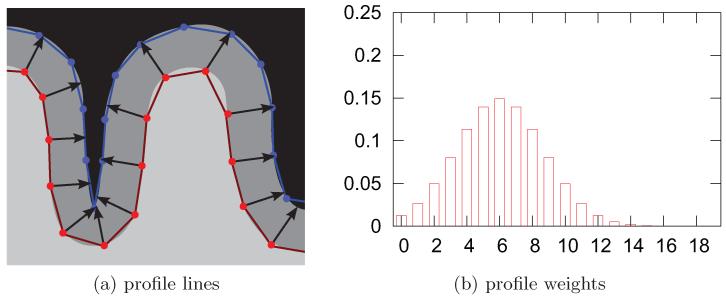
Figure 2.
This figure illustrates the surface mapping by stochastic sampling of the MR volumes. Fig. (a) shows how transcortical profiles lines were defined, and Fig. (b) shows how the values sampled along these profiles lines were weighted (b). The x-axis in (b) indicates the relative position of the sample, zero denoting the start point on the gray-white matter interface and 19 the last point on the pia mater. The kernel weights are given at the y-axis.

