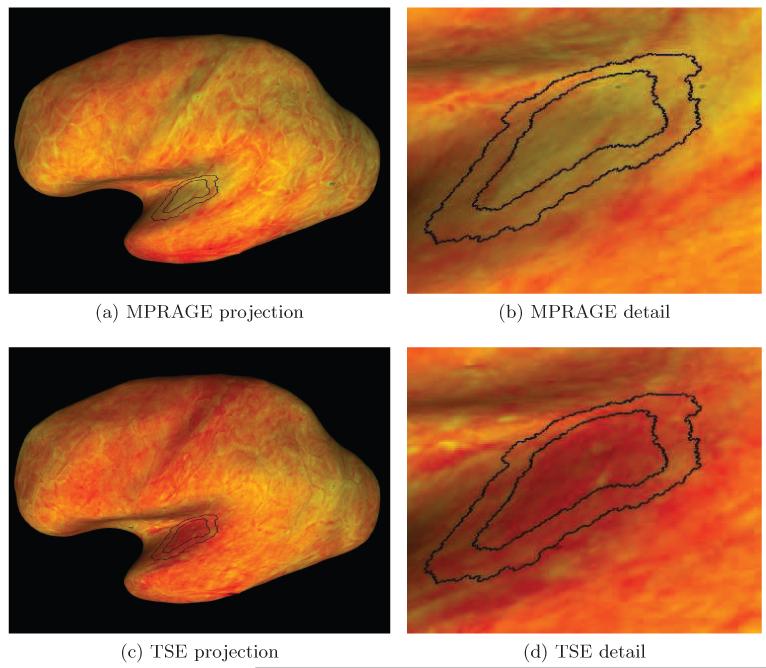
Figure 3.
This Figure shows the values of MPRAGE (a) and TSE (c) computed for the left hemisphere of one representative subject, and projected onto the inflated inner cortical surface. Figures (b,d) show a portion of the maps centered at the estimated location of the transverse temporal gyrus in detail. The heat scale used for the MPRAGE and TSE values uses red for low and yellow for high intensities. The black lines indicate the boundaries of the initial regions Rin and Rout (cf. Sec. 2.5).

