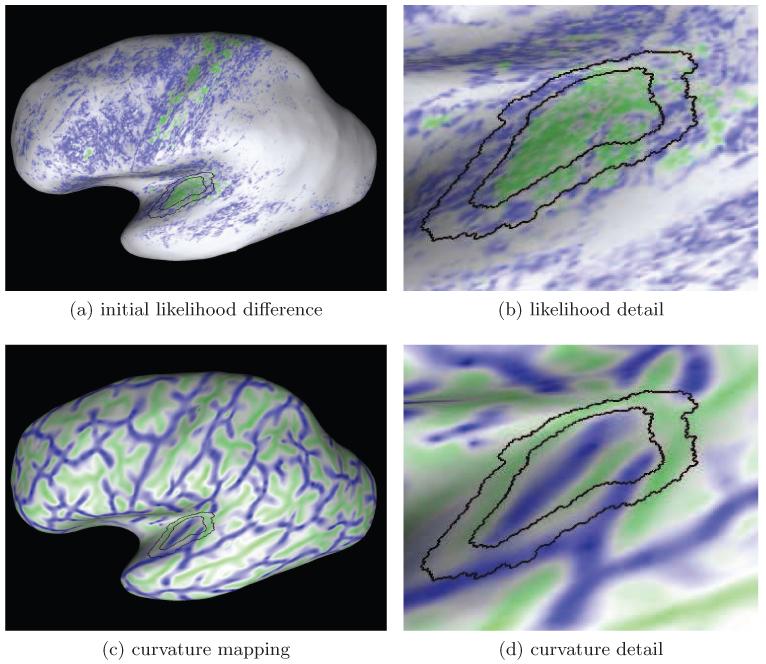
Figure 4.
This Figure shows the initial likelihood difference map (a) and the curvature map due to the embedding of the cortical sheet in 3D (c) for the left hemisphere shown in Figure 3. Figures (b,d) show a portion of the maps centered at the transverse temporal gyrus. The color scale in the likelihood-difference map uses blue for negative, white for values near zero and green for positive values. In Figures (c-d) green color indicates positive curvature values (i.e. gyri) and blue color indicates negative curvature (i.e. sulci). The black contours represent the boundaries of the sampling regions.

