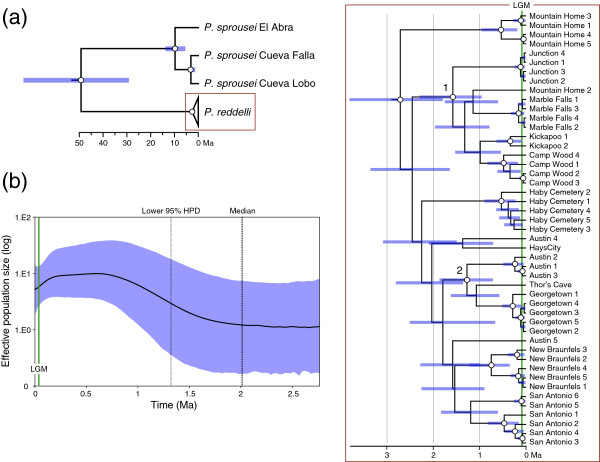
Figure 2.
Phylogeographical structure and demographic reconstruction through time inferred from 1,152 base pairs of mitochondrial DNA for the North American vaejovid scorpions Pseudouroctonus reddelli and Pseudouroctonus sprousei . (a) Time-calibrated Bayesian gene tree for P. reddelli and P. sprousei. Nodes that received ≥ 0.95 posterior probability support depicted with white dots. Two strongly supported subclades of P. reddelli are numbered (1 and 2). (b) Bayesian skyride plot for P. reddelli, showing change in effective population size of females since the time of the most recent common ancestor. HPD = highest posterior density; LGM = Last Glacial Maximum.

