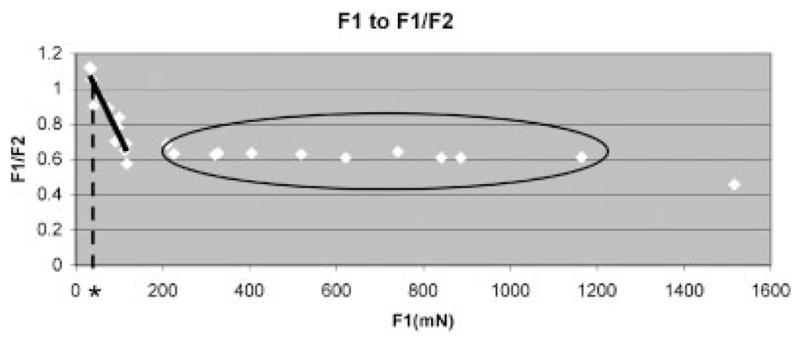
Figure 4.

Ratio of F1 to F1/F2. Black solid line shows linear approximation of the data in the range of F1 < 150 mN (F2/F1 = −0.005 F1 + 1.237, R2 = 0.877). Black dotted line is a tangent drawn from the cross point of the linear approximated line and F2/F1 = 1 (asterisk indicates its cross point to the x-axis). Black circle indicates data with relatively constant F2/F1, ~0.6.
