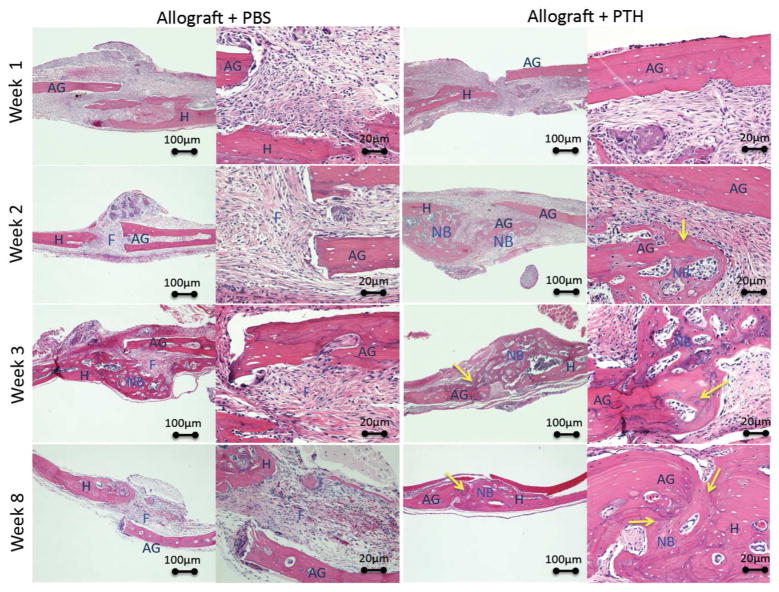
Figure 5. Histological analysis of bone formation and graft-host integration shows enhanced bone formation after PTH therapy.
Animals received allogeneic bone grafts and were treated with PTH or PBS (placebo). The animals were sacrificed 1, 2, 3, or 8 weeks after the operation, and the calvarial region was harvested and stained with H&E. AG - Allograft, H - Host, F - Fibrous tissue, NB - new bone formation. Arrows indicate the sites of allograft integration and revitalization.

