
Figure 6. Mast cell infiltration was affected by PTH therapy, as detected using immunohistofluorescence (IHF) and toluidine blue staining.

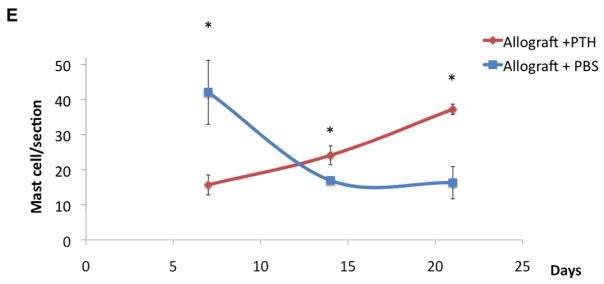
Seven days after surgery, specimens were obtained from mice implanted with allografts and treated with PBS (placebo) (A & C) or PTH (B & D). After fixation and slicing, the sections were stained with antibodies against the mast cell markers mast cell protease 1 (MCP1) and mast cell tryptase (MCT) (A & B). Following that, the sections were stained with toluidine blue, which was useful for longitudinal mast cell quantification (C & D). Numbers of mast cells in both groups (E). Mast cells were manually counted in 36 toluidine blue–stained sections obtained from animals at 1, 2, and 3 weeks after surgery. Bars represent ± SE; * p < 0.05.