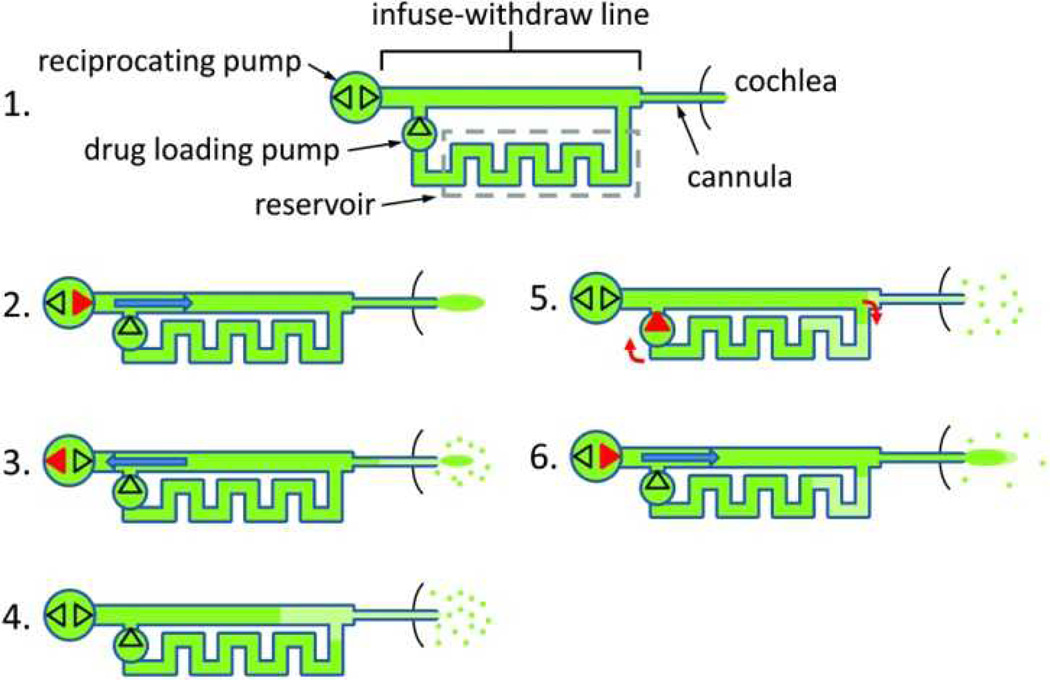
Figure 1.
Schematic of the controllable dose drug delivery system and the operation sequence. Red features indicate which of the pumping components is active at each step. The dots near the cannula outlet represent drug dispersal by diffusion. The dark green segments show drug solution at full concentration and the light green segments show drug diluted with endogenous fluid (perilymph). Channels are not drawn to scale.

