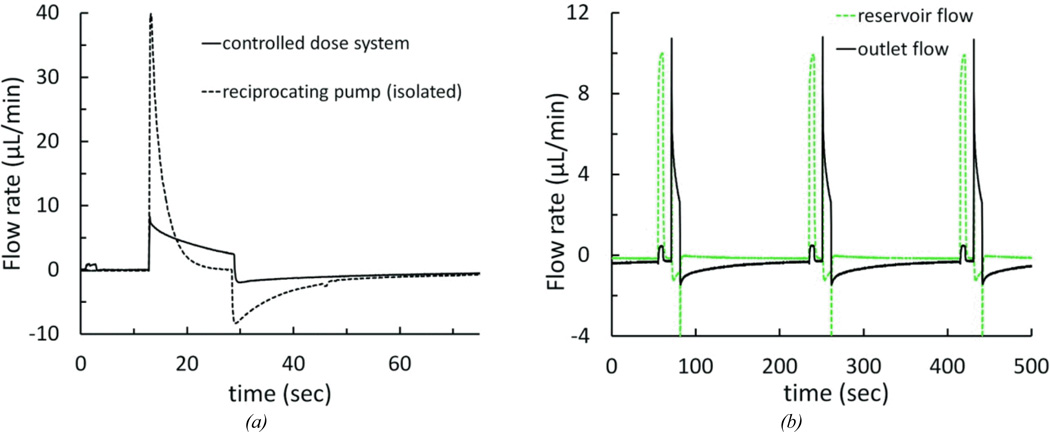
Figure 10.
Flow rate profiles for the controllable dose system (a) Flow rate measured at the cannula outlet for the complete system at normal operating conditions, and with the reciprocating pump and infuse-withdraw line fluidically isolated by clamping off the drug loading pump and reservoir. The cycle had a 10-second drug loading pump stage, 5 V 16-second reciprocating pump infuse stage, followed by a 10-minute idle stage. (b) Reservoir flow and outlet flow for a system operating at 10-second drug loading stage, a 5 V 16-second reciprocating pump infuse stage, followed by a 3-minute idle stage.

