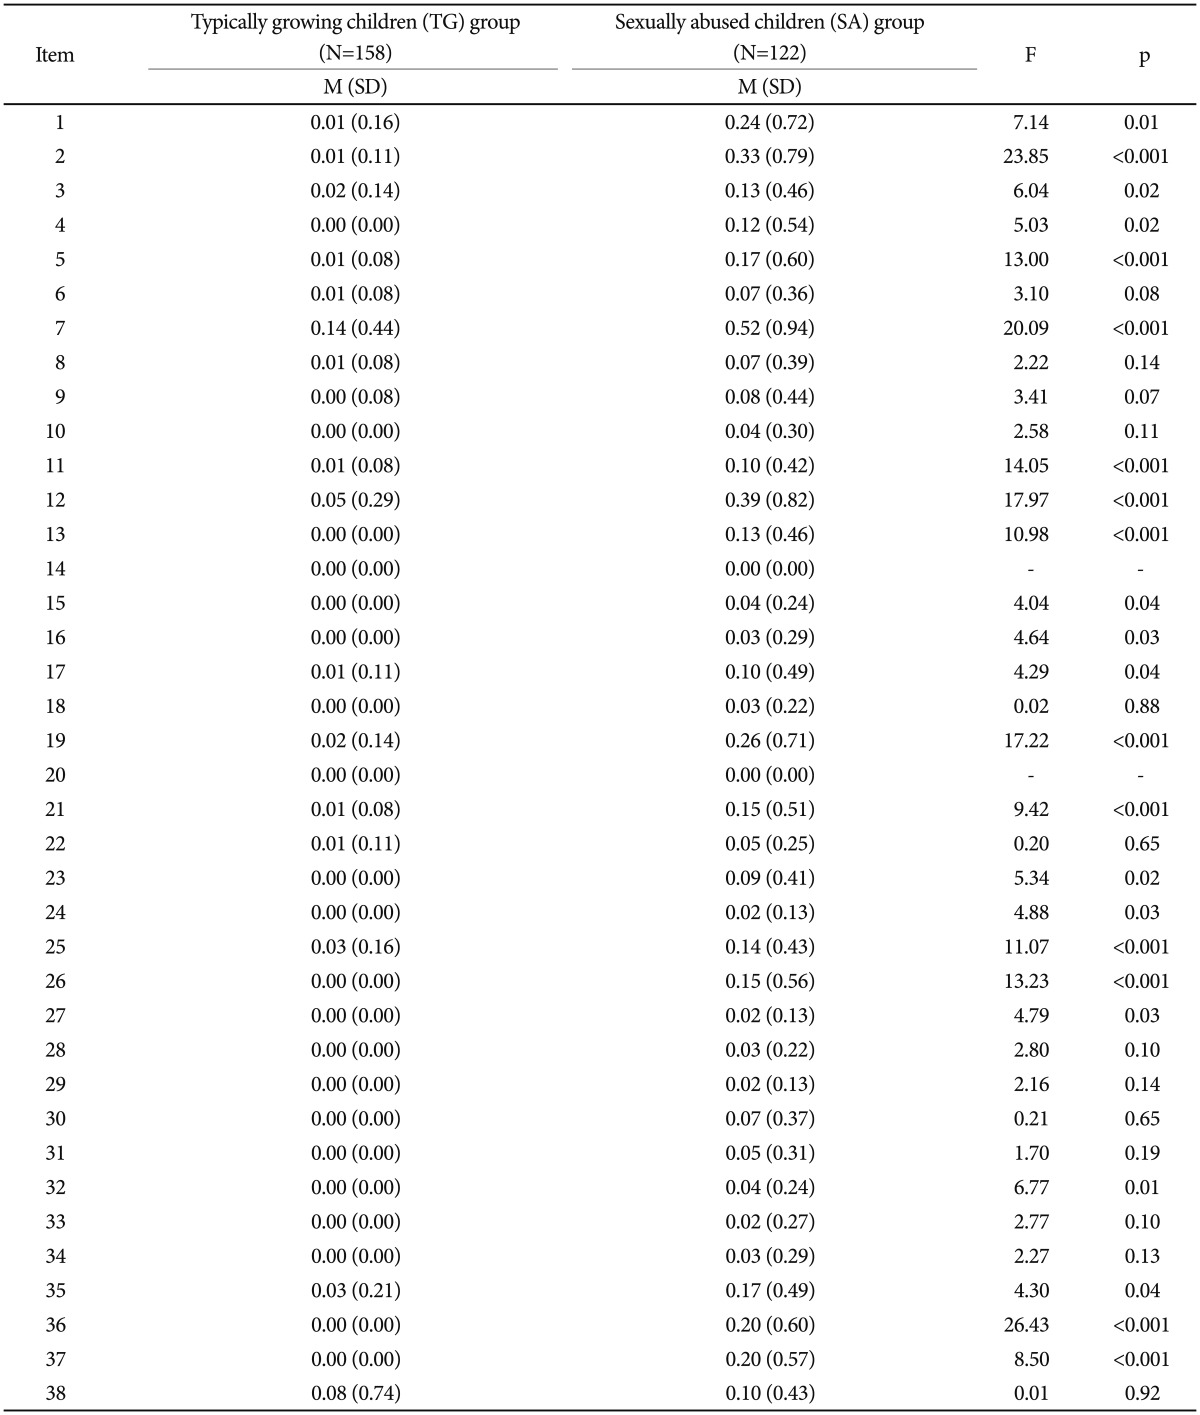
Table 5.
Differences in each item mean CSBI score between the typically growing children group and sexually abused children group

N: number, M: mean, SD: standard deviation, CSBI: Child Sexual Behavior Inventory
Differences in each item mean CSBI score between the typically growing children group and sexually abused children group

N: number, M: mean, SD: standard deviation, CSBI: Child Sexual Behavior Inventory